Illnesses After Administration of Presumed Counterfeit Botulinum Toxin in Nonmedical Settings — Tennessee and New York City, March 2024
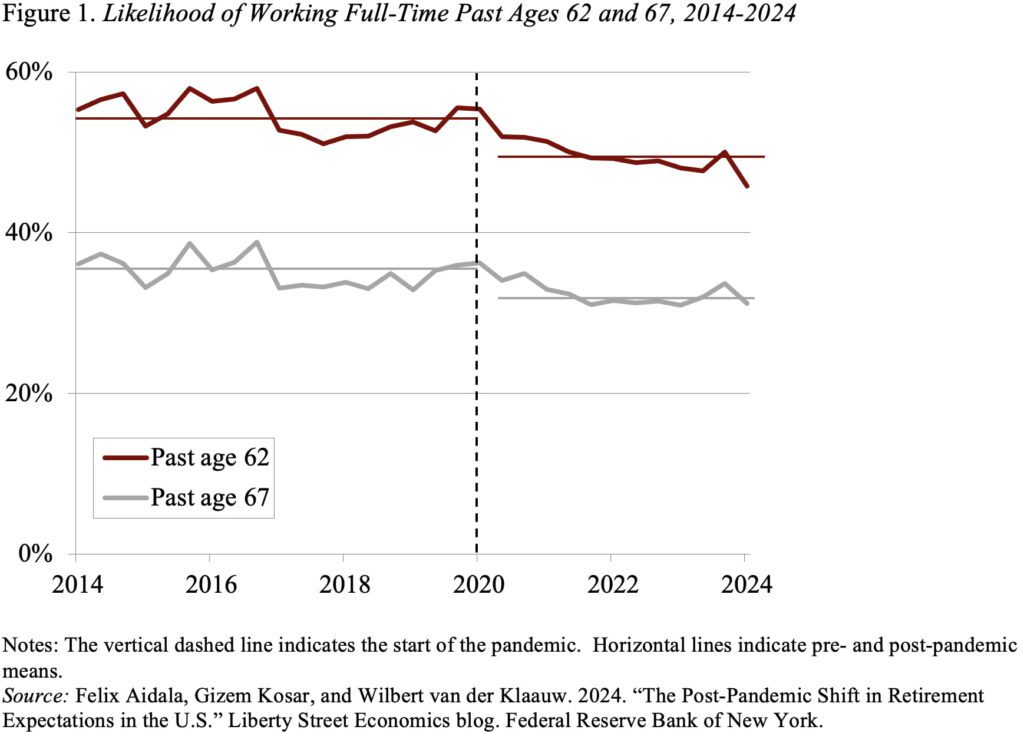
Older men die by suicide at steep rates. Here’s how the VA is trying to change that The suicide rate spikes for men in the U.S. as they age, according to 2022 estimates from the National Center for Health Statistics.
We found over 300 million young people had experienced online sexual abuse and exploitation over the course of our meta-study
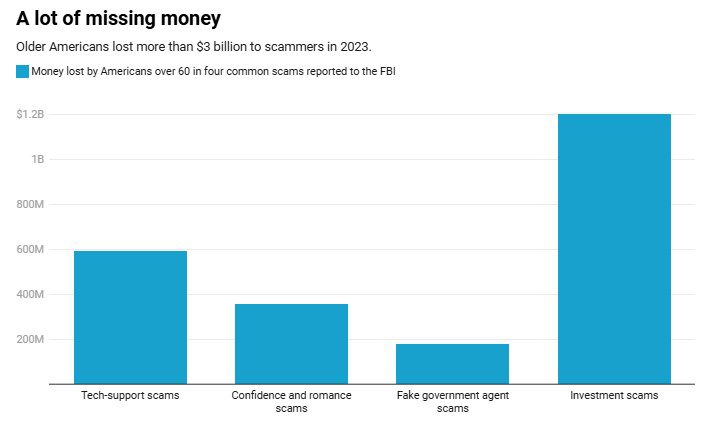
Elder fraud has reached epidemic proportions – a geriatrician explains what older Americans need to know