
Teen Drinking and Driving: A Dangerous Mix
 CDC
CDC
Key Welsh Economic Statistics – November 2012
 wales.gov.uk
The unemployment rate in Wales was 8.2 per cent of the economically active population during July to September 2012, down from 9.3 per cent a year ago.
Wide and Growing Income Gaps in Most States
 CBPP
CBPP
Latinos Express Growing Confidence In Personal Finances, Nation’s Direction

Number of SSI Recipients, 1974–2011
 SOURCE: Social Security Administration, Supplemental Security Record (Characteristic Record Extract format), 100 percent data.
Most Americans See China as a Competitor

Behind Gay Marriage Momentum, Regional Gaps Persist

Number of Americans with Mobile Connections to the Web on the Rise

Size of Income, 1962 and 2010
 SSA
SSA
SOURCES: Data for 1962 are from Social Security Administration, The Aged Population of the United States: The 1963 Social Security Survey of the Aged (1967). Data for 2010 are Social Security Administration calculations from the March 2011 Annual Social and Economic Supplement to the Current Population Survey.
Risk of relative poverty of men and women by age, OECD average, 2008
 The Atlantic
Poverty rate of the entire population = 100
Most in China See Growing Income Inequality

Statistics on NHS Stop Smoking Services: England, April 2012 to June 2012

Key Facts
• 176,945 people set a quit date through NHS Stop Smoking Services, a decrease of 17% (35,363) on the final figure for same period in 2011/12 (212,308), and an decrease of 7% (13,473) on the final figure for the same period in 2010/11 (190,418).
• At the 4 week follow-up 86,341 people had successfully quit (based on self-report), 49% of those setting a quit date. This is a decrease of 15% (15,214) on the final figure for the same period in 2011/12 (101,555), and also a decrease of 3% (3,074) on the final figure for the same period in 2010/11 (89,415).
Measuring National Well-being – Measuring children’s well-being

Figure 2: Percentage of children born with a low birth weight for selected OECD countries, 2011 International
CIS-2008 Major Findings Supplementary Tables: Duration of Maltreatment by Primary Substantiated Maltreatment
 Canadian Incidence Study of Reported Child Abuse and Neglect-2008
Figure 1: Duration of maltreatment by primary category of substantiated maltreatment, including confirmed risk of future maltreatment, in Canada in 2008
Youth unemployment mapped
 Guardian | Google
More Americans Worry about Financing Retirement

Soup Kitchens Caused the Great Depression
Thumbnail

Educational Distribution of Inmate Population, Men Ages Twenty to Thirty-Four, 1980 and 2008
 Russell Sage Foundation
In-patients formally detained in hospitals under the Mental Health Act, 1983 – and patients subject to Supervised Community Treatment – Annual Figures, England 2011/12

Figure 5: Outcomes of Section 136 orders by year (where the place of safety was a hospital)
Social care network member survey results: infographic
Thumbnail
 Guardian | S Oneill
Shares of aggregate income, by source, U.S. 2010
 Social Security Administration
Estimated Gaps in Reading Achievement Between High-Low Income (90/10 Ratio) and Black-White Students, by Birth Year, 1940-Present

Asylum applicants and first instance decisions on asylum applications: second quarter 2012 – Issue number 12/2012
 Eurostat
Daily Number: 87% – Pakistani Public Differs from Taliban on Education of Girls

Civilian Incarceration Rates, Men Ages Twenty to Thirty- Four, by Education, 1980 to 2008
 Russell Sage
What’s Driving Projected Debt?

A Third of Young Adults Not Affiliated with a Religion

TANF Block Grant Is Not a Model for Other Programs

Examining the Romney Budget Proposals

Couple families by presence of children in private households, 2011 counts, children (all ages), for Canada, provinces and territories
 statcan.gc.ca
TABLE 1. Estimated number* and percentage of new diagnoses of HIV infection among Hispanics or Latinos† aged ≥13 years, by U.S. Census region§ and selected characteristics — 46 states and Puerto Rico, 2010
 CDC
CDC
Only a portion of table displayed above
Which Tax Cuts Should We Extend?

Downturn and Legacy of Bush Policies Drive Large Current Deficits
 CBPP
CBPP
Deficit Reduction, Phase One

The state’s anti-poverty effect
Thumbnail

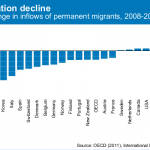
Migration in a crisis
Thumbnail

Sources of Social Security revenues in 2011
 SOURCE: 2012 Annual Report of the Board of Trustees of the Federal Old-Age and Survivors Insurance and Disability Insurance
Trust Funds, Table II.B1.
NOTE: Totals do not necessarily equal the sum of rounded components.
Record Levels of Student Loan Debt Hit Younger Households Hard

What Was Actually in Bowles-Simpson — And How Can We Compare it With Other Plans?

4.1% – A Recovery from Great Recession Bypassing American Households

Ratio of covered workers to Social Security beneficiaries
 SOURCE: 2012 Annual Report of the Board of Trustees of the Federal Old-Age and Survivors Insurance and Disability Insurance Trust Funds, Table IV.B2.
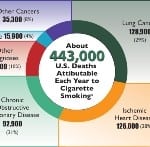
Infographic: Annual Deaths Attributable to Cigarette Smoking—United States, 2000–2004
Thumbnail
 CDC
CDC
How people get local news and information in different communities

A Record One-in-Five Households Now Owe Student Loan Debt

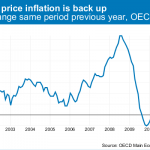
Food inflation rises
Thumbnail
 OECD
OECD
Food prices have increased over the year to January 2011 in many of the world’s economies. Moreover, those increases, which accelerated from mid-2010, reversed the downward trend in food prices of 2009 and the first half of 2010.
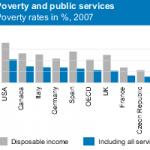
Rates of Not Getting Needed Care Because of Cost
 Commonwealth Fund
Figure 1: Proportion of population being at risk of poverty or social exclusion, 2010
 Eurostat
Growing Partisan Divide over Social Safety Net

Reality Check on Who Pays Taxes
 CBPP
CBPP
The fact that most people who don’t owe federal income tax in a given year do pay substantial amounts of other taxes — and also are net income taxpayers over time — belies the claim that households that do not owe income tax in a given year will form bad policy judgments because they “don’t have any skin in the game.”