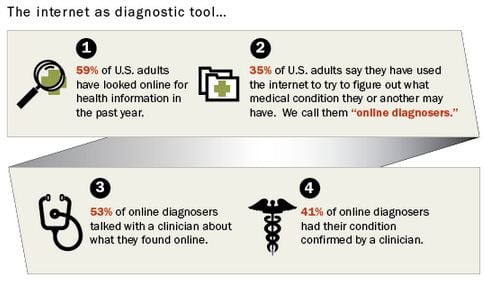
 Pew
Pew
Debt ceiling: Is Social Security at risk?
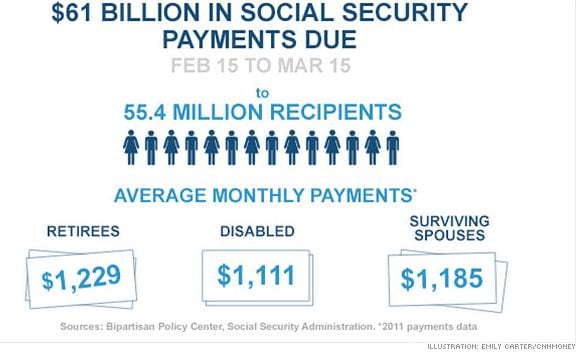 CNN Money | E Carter
Roe at 40: New Infographics Illustrate Key Facts
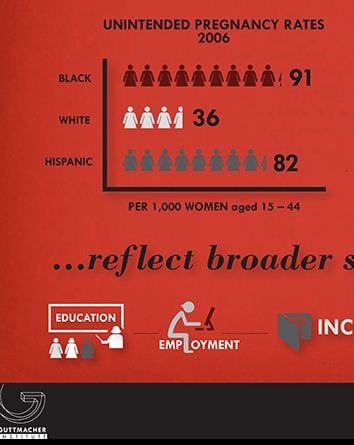 www.guttmacher.org
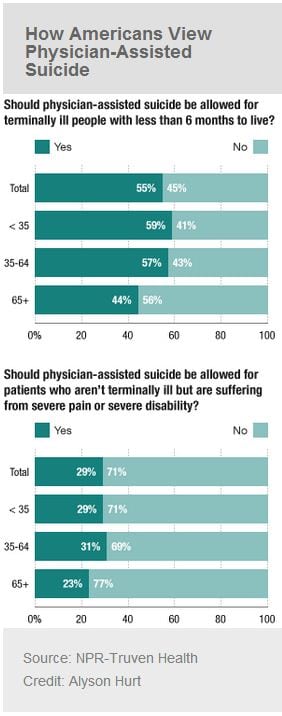
Americans Support Physician-Assisted Suicide For Terminally Ill
Hate Crimes Accounting
 FBI
FBI
Percentage of Hospitalizations After Emergency Department Visits Resulting from Illness and Injury Among Persons Aged ≤18 Years, by Age Group — National Hospital Ambulatory Medical Care Survey, United States, 2007–2010
Brainwashed by Tory welfare myths
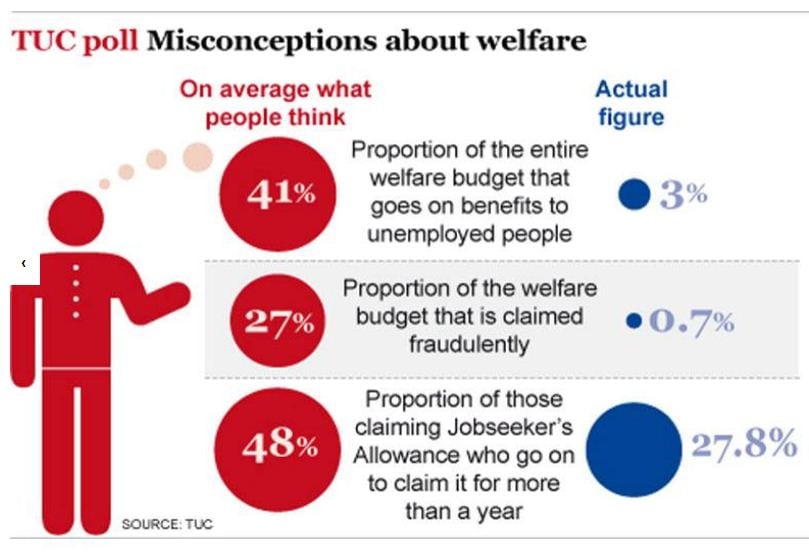 The Independent | TUC
Hispanic Pregnancies Fall in U.S. as Women Choose Smaller Families

America’s ‘Mormon Moment’ is Over, and Public Opinion is Little Changed
 Pew
Pew
Figure GPS-21. Trends in last 12 months prevalence of ecstasy use among young adults (aged 15–34)
 European Monitoring Centre for Drugs and Drug Addiction (EMCDDA)
UK welfare spending: how much does each benefit really cost?
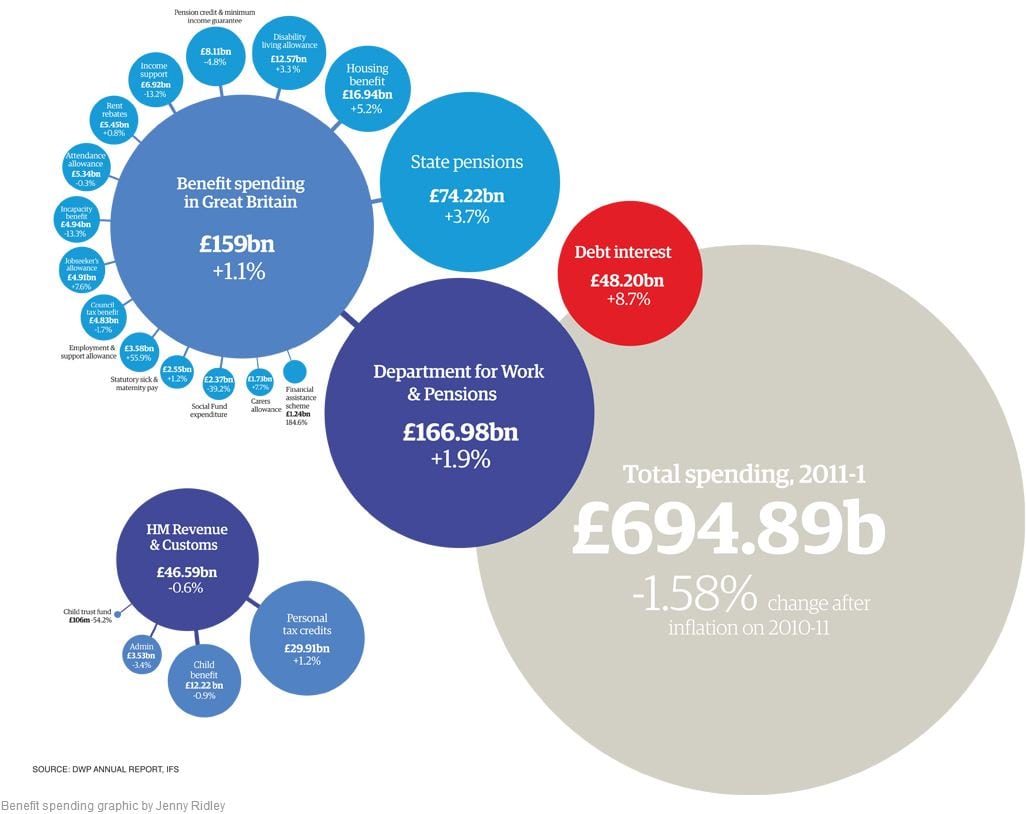 Guardian
Figure GPS-20. Lifetime prevalence of cocaine use among young adults (aged 15–34) in Europe, Canada, Australia and the USA
 European Monitoring Centre for Drugs and Drug Addiction (EMCDDA)
How Does the Affordable Care Act Cover the Uninsured?
 Commonwealth Fund
The Affordable Care Act’s requirement that employers and insurers offer dependent coverage has brought coverage to over 6 million young adults. By 2020, 30 million people will gain insurance through the Affordable Care Act.
A Chicago Divided by Killings
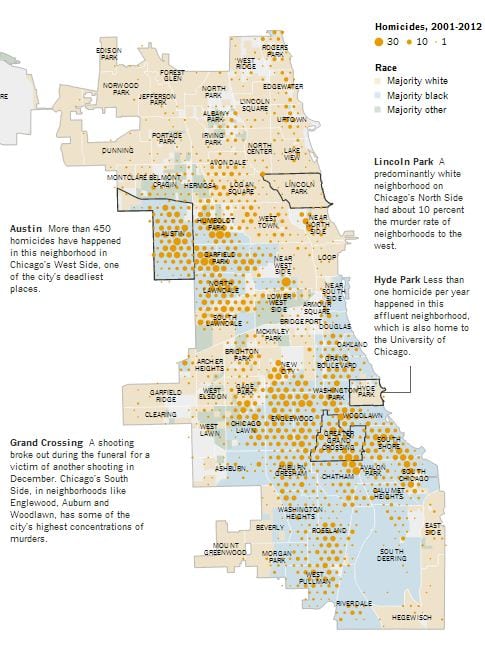 NY Times
Figure GPS-17. Last 12 months prevalence of amphetamines, ecstasy and cocaine use among young adults (aged 15 to 34)
 European Monitoring Centre for Drugs and Drug Addiction (EMCDDA)
Psychometric assessment of the Primary Care Behavioral Health Provider Adherence Questionnaire (PPAQ): Coefficient alphas and intercorrelations of the PPAQ and LIM
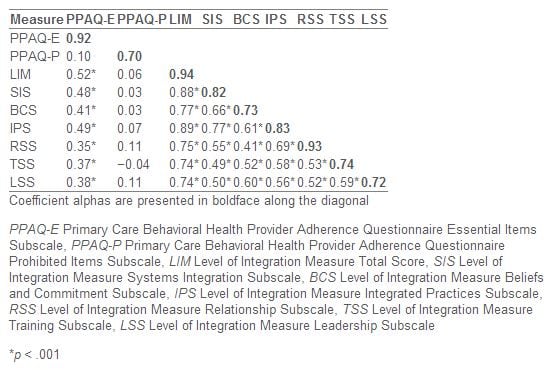 Transl Behav Med. 2013 December; 3(4): 379–391.
Drug and Alcohol Use – A Significant Risk Factor for HIV
 NIDA
NIDA
Spotlight on Poverty and Opportunity
 spotlightonpoverty.org
Public social spending based on detailed data for 1960-2009; national aggregates for 2010-2011 and estimates for 2012, in percentage of GDP
 https://www.oecd.org/
Wounded Warrior Pose
 NY Times
Maternal opiate use and newborns suffering from opiate withdrawal are on the rise in the U.S.
 NIDA
NIDA
Public Attitudes toward Gun Control
Thumbnail
 Pew
Pew
The Best (and Worst) of Mobile Connectivity
 Pew
Pew
Texting Is Nearly Universal Among Young Adult Cell Phone Owners
 Pew
Pew
% of cell phone users who use their phone to send or receive text messages. No indication of whether or not engaging in this behavior results in any meaningful improvement to one’s life (e.g., costs vs benefits).
Food Hardship Rate in 2010-2011 by Congressional District
 frac.org
Food Hardship is the percentage of people surveyed by the Gallup organization that answered yes to the question: “Have there been times in the past twelve months when you did not have enough money to buy food that you or your family needed?”
US State Rankings: Heatlh and Wellness
 thestatesproject.org
12-month prevalence of DSM-IV/WMH-CIDI disorders by sex and cohort 1 (n=9282)
 https://www.hcp.med.harvard.edu/ncs/
1This table includes updated data as of July 19, 2007. Updates reflect the latest diagnostic, demographic and raw variable information.
2 Assessed in the Part II sample (n = 5692).
3 Assessed in a random one-third of the Part II sample (n = 2073).
4 Assessed in the Part II sample among respondents in the age range 18-44 (n = 3197).
5 Estimated in the Part II sample. No adjustment is made for the fact that one or more disorders in the category were not assessed for all Part II respondents.
6 The estimated prevalence of any impulse-control disorder is larger than the sum of the individual disorders because the prevalence of intermittent explosive disorder, the only impulsecontrol
disorder that was assessed in the total sample, is reported here for the total sample rather than for the sub-sample of respondents among whom the other impulse-control disorders
were assessed (Part II respondents in the age range 18-44). The estimated prevalence of any impulse-control disorder, in comparison, is estimated in the latter sub-sample. Intermittent
explosive disorder has a considerably higher estimated prevalence in this sub-sample than in the total sample.
7 Disorder with hierarchy
More People Walk to Better Health
 CDC
CDC
More than 145 million adults now include walking as part of a physically active lifestyle. More than 6 in 10 people walk for transportation or for fun, relaxation, or exercise, or for activities such as walking the dog.
11.1 Million Unauthorized Immigrants Were Living in the U.S. in 2011

DHAP Annual Report: Accelerating Progress, Investing for Impact
 CDC
CDC
Teachers Say that for Students Today ‘Research = Googling’

The Research SUPPLEMENTAL POVERTY MEASURE: 2011

US: Economic opportunity by state

Unemployment Rates by Education, 2007-2012
 www.cepr.net
Pro–’Right to Work’ Groups In Michigan Outspend Union Counterparts
 The Nation
Housing Cost as a Percentage of Income for Households with Children
 FIFCFS | Institute for Children, Poverty & Homelessness
Better Transportation Options = Healthier Lives
![]() RWJF
RWJF
Nonprofits and the Economy
 www.nonprofitquarterly.org
Seniors’ Reported Sources of Information About Medicare Drug Benefit
 www.kff.org
Among the 52% of seniors who say they received information aboutthe Medicare drug benefit: Percent who say they received information from . . .
Most Americans Believe Failure to Avoid Fiscal Cliff Would Have a Major Impact

Lifetime prevalence of DSM-IV/WMH-CIDI disorders by sex and cohort (n=9282)
 https://www.hcp.med.harvard.edu/ncs/
1 This table includes updated data as of July 19, 2007. Updates reflect the latest diagnostic, demographic and raw variable information.
2 Assessed in the Part II sample (n = 5692).
3 Assessed in a random one-third of the Part II sample (n = 2073).
4 Assessed in the Part II sample among respondents in the age range 18-44 (n = 3197).
5 Estimated in the Part II sample. No adjustment is made for the fact that one or more disorders in the category were not assessed for all Part II respondents.
6 Disorder with hierarchy
Gap Between Need and Availability of Affordable Units for Poor Renters
 Institute for Children, Poverty & Homelessness
Child Injury
 CDC
CDC
Car crashes, suffocation, drowning, poisoning, fires, and falls are some of the most common ways children are hurt or killed.
United States Cancer Statistics: Top Ten Cancers 2004-2008 Women

Many Americans Don’t Fully Understand Fiscal Cliff Impact

Number of Poor Rental Households and Available Affordable Units
 Institute for Children, Poverty & Homelessness
Breast Cancer
 CDC
CDC
Black women have the highest death rates of all racial and ethnic groups and are 40% more likely to die of breast cancer than white women.
Number of new HIV Infections among youth by sex and race/ethnicity—United States, 2010
 CDC. Vital Signs: HIV Infection, Testing, and Risk Behaviors Among Youths – United States. MMWR 2012:61
HIV Among Youth in the US
 CDC
CDC
About 50,000 people are infected with HIV each year, and 1 in 4 is 13 to 24 years old.
History Of Automatic Cost-Of-Living Adjustments: Social Security in US
 SSA
SSA