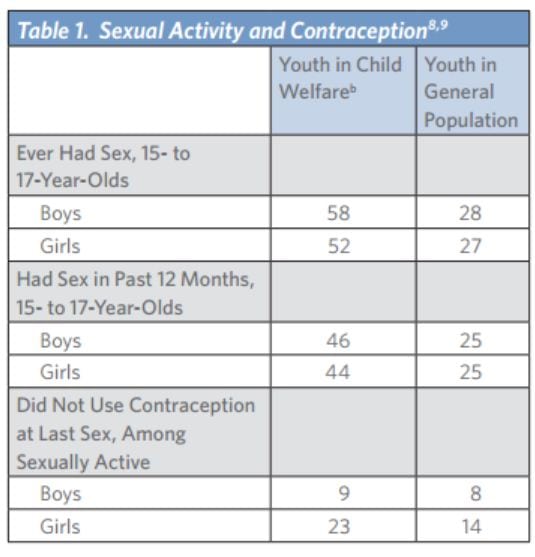
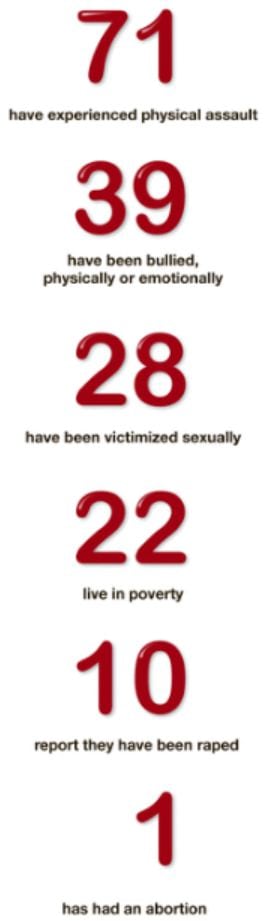
 The National Campaign
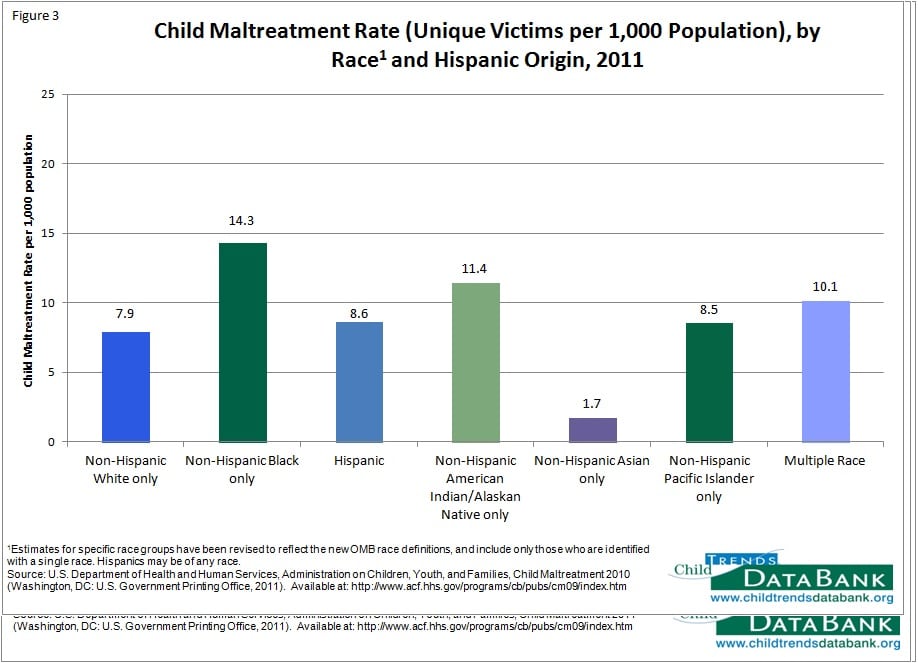
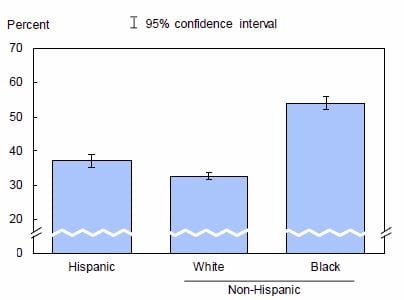
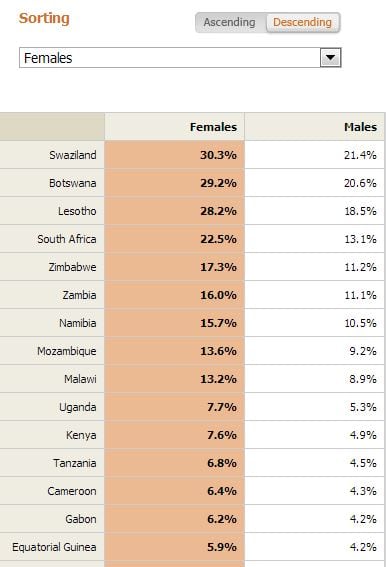
Child maltreatment: Race and Hispanic origin
ATR Ignores Main Point of Tobacco Taxes: Fewer Smoking Deaths
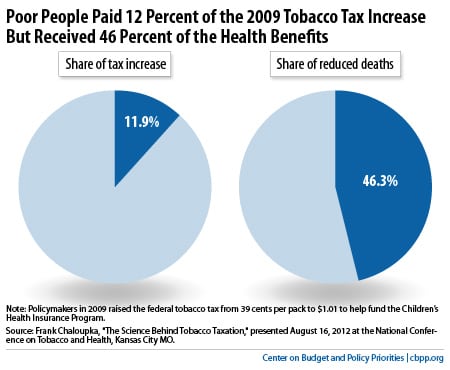 CBPP
CBPP
New Research Shows SNAP, Facing Big Cuts in the House, Reduces Extreme Poverty
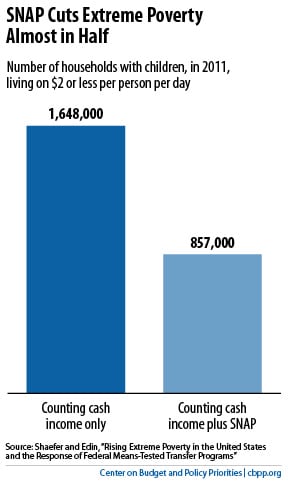 CBPP
CBPP
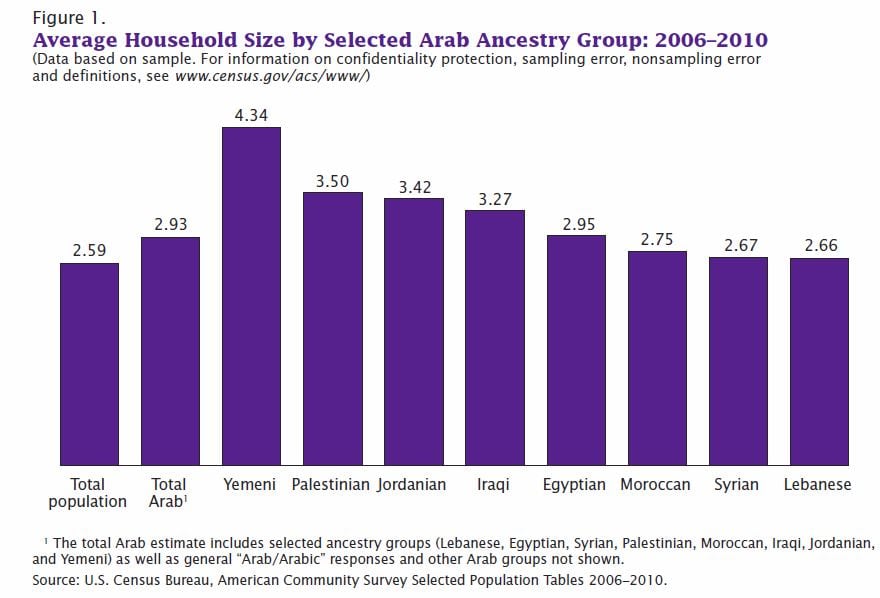
Arab Households in the United States: 2006-2010
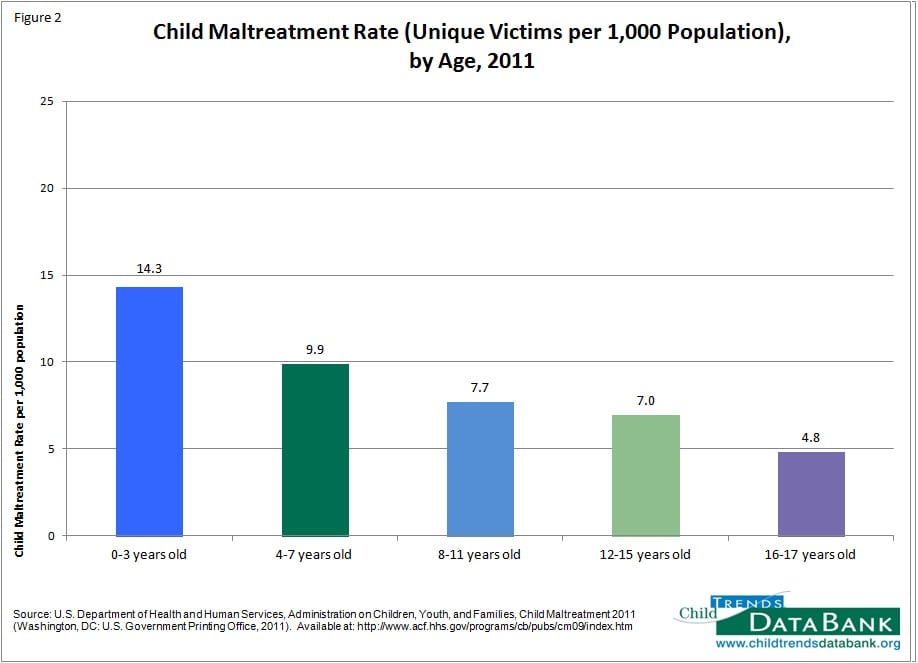
Child maltreatment: Across ages
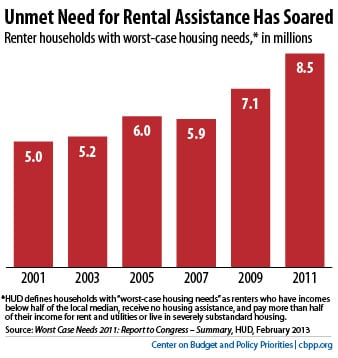
House Bill Makes Deep Cuts in Low-Income Housing Assistance
 CBPP
CBPP
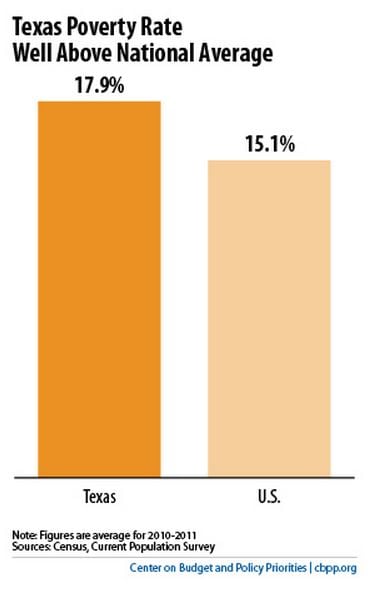
Texas Model Isn’t All That It Seems
Emergency room wait times for Vermont psychiatric patients hit a high
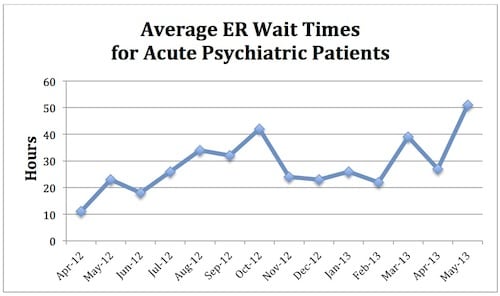 VT Digger
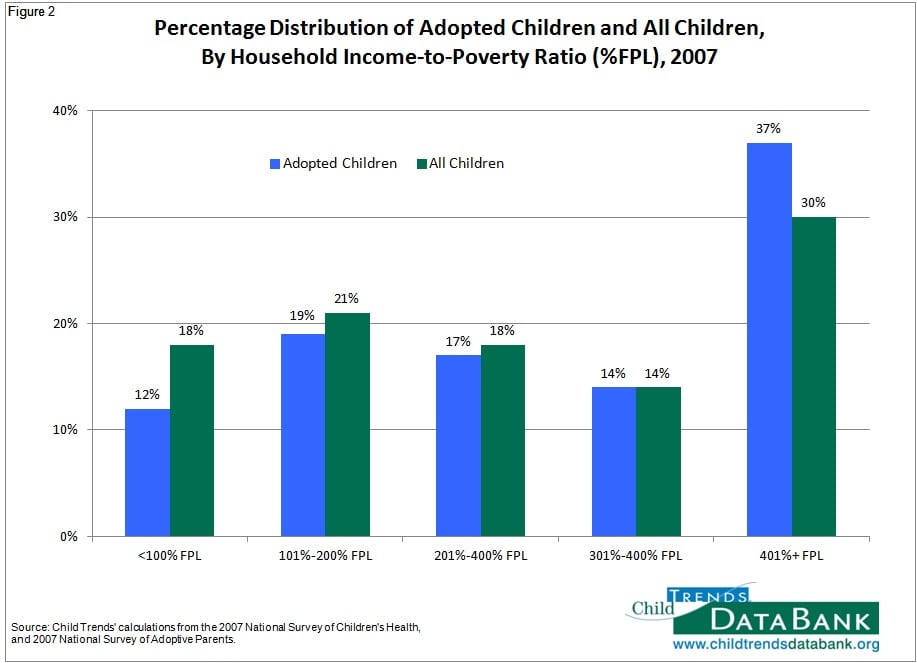
Adopted vs all children: Poverty
Reasons social workers don’t receive supervision
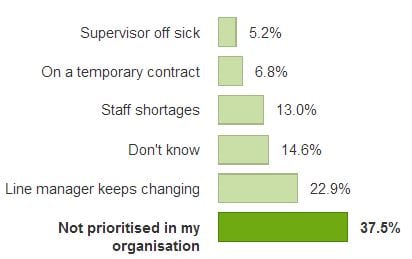 communitycare.co.uk
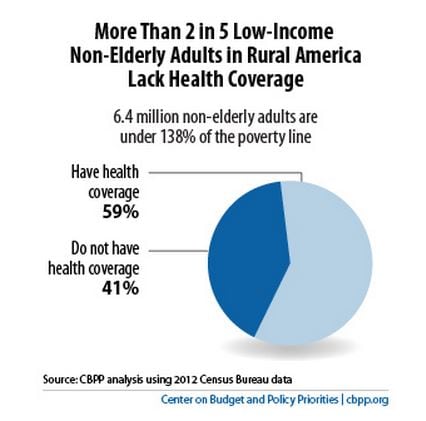
Medicaid Expansion Will Boost Rural Health Coverage and Economies
The Hypothetical HS Class of 2013 – Out of 100:
 NY Times | Child Trends
Child Abuse and Neglect Fatalities 2011
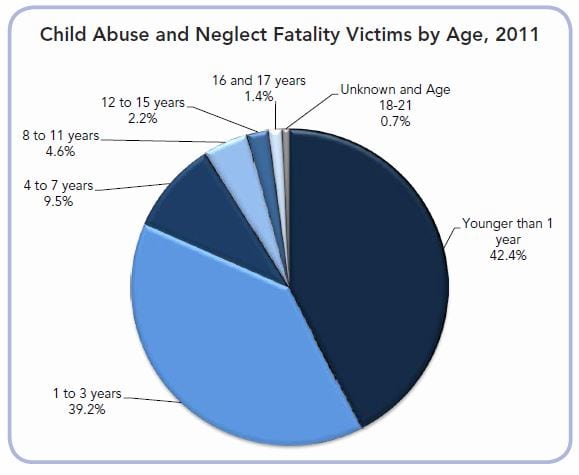 childwelfare.gov
Older workers in the labor force in selected European Union countries, as a percentage of their age group, 2001 and 2011
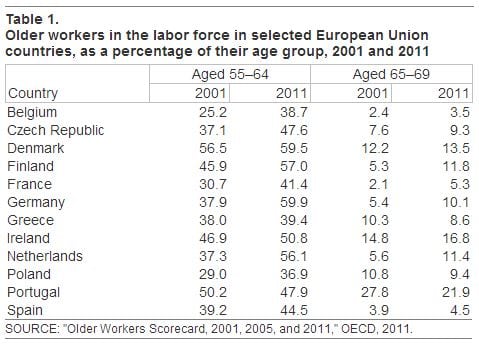 SSA
SSA
If the Economy Is Back, Why Are Wages Still So Low?
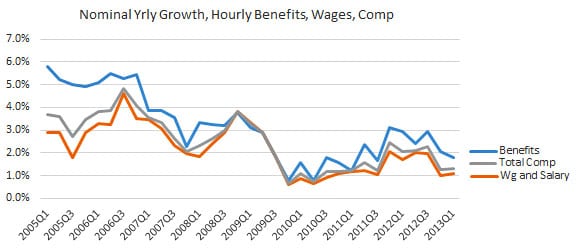 Mother Jones
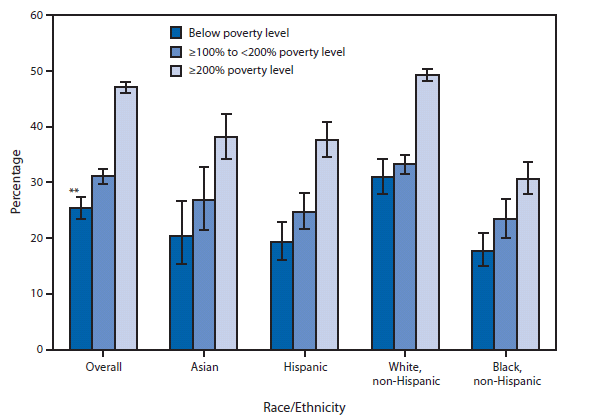
Percentage of Persons Aged <18 Years Who Received Special Educational or Early Intervention Services,* by Race/Ethnicity — National Health Interview Survey, United States, 2001 and 2011
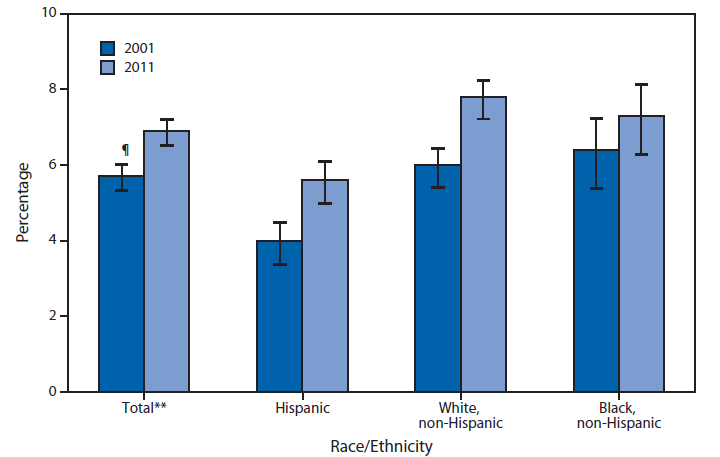 CDC
CDC
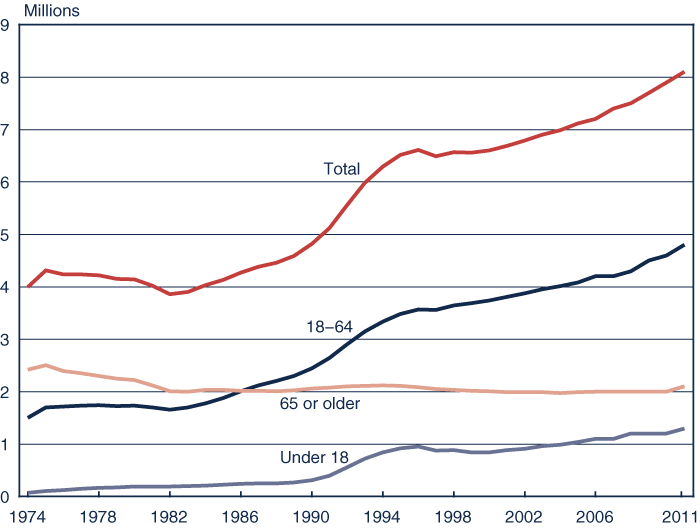
Number of people receiving Social Security, Supplemental Security Income (SSI), May 2013 (in thousands)
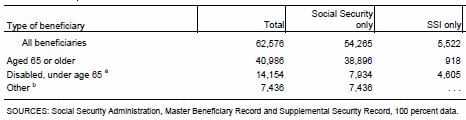 SSA
SSA
Equal Employment Opportunity Tabulation
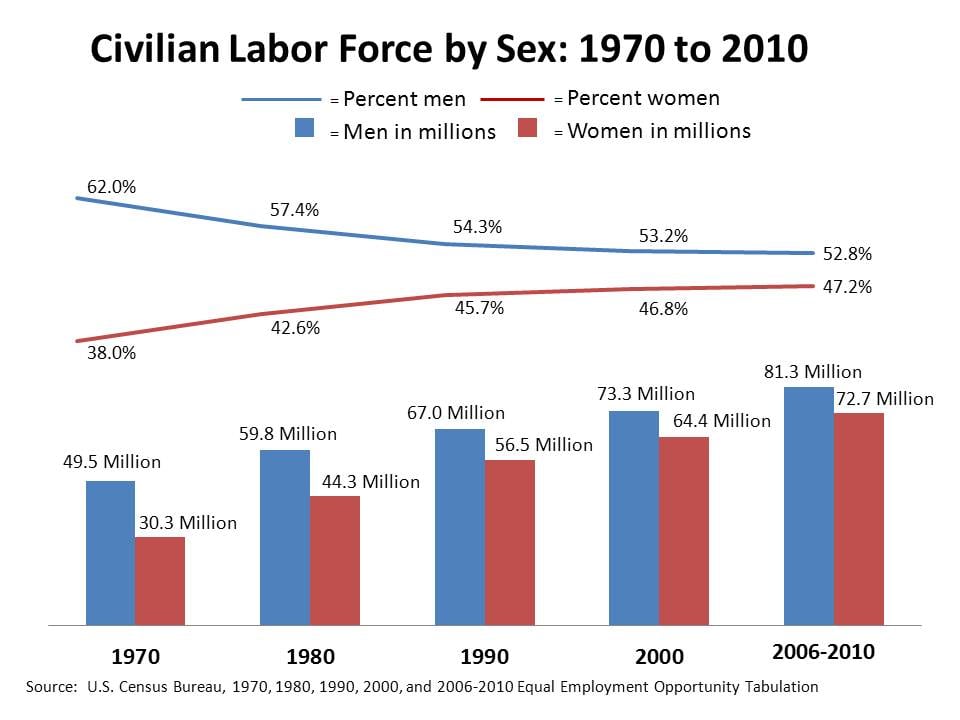 Census Bureau
Premium Assistance in Medicaid
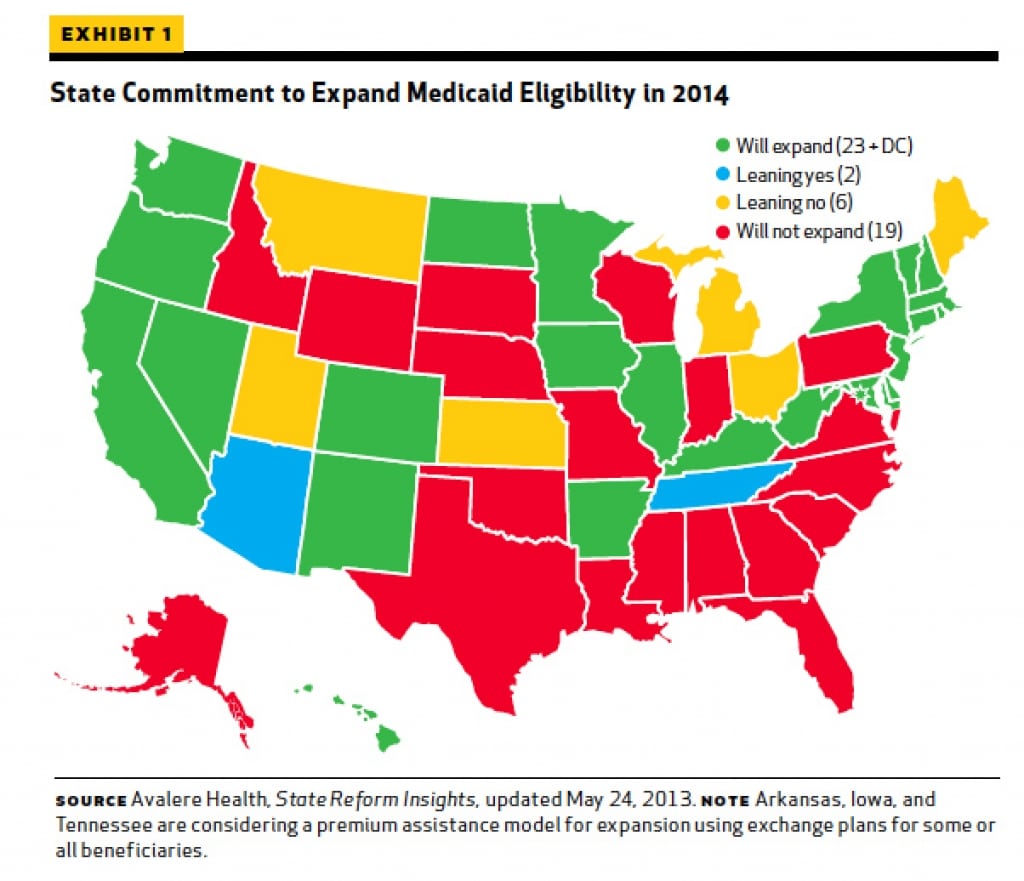 Health Affairs
State Policies on Same-Sex Marriage (click for interactive mar/timeline)
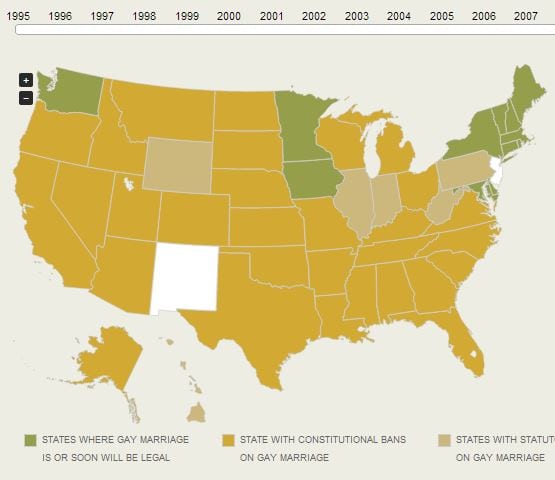 Pew
Pew
Don’t Forget Tax Avoidance!
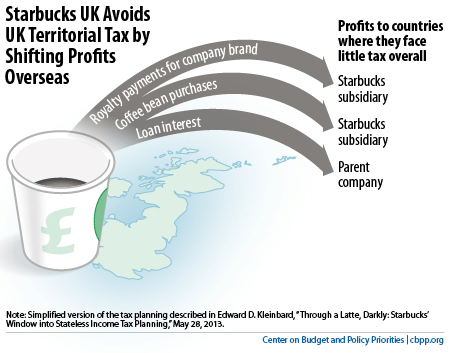 jaredbernsteinblog.com/
Factoring in Face Time
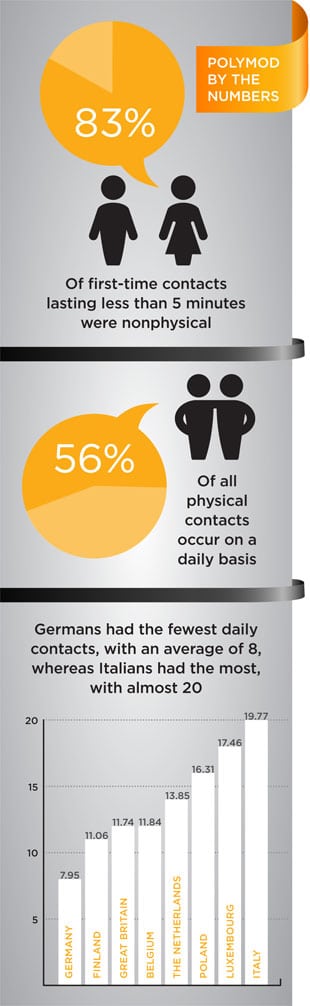 The Scientist | PLOS
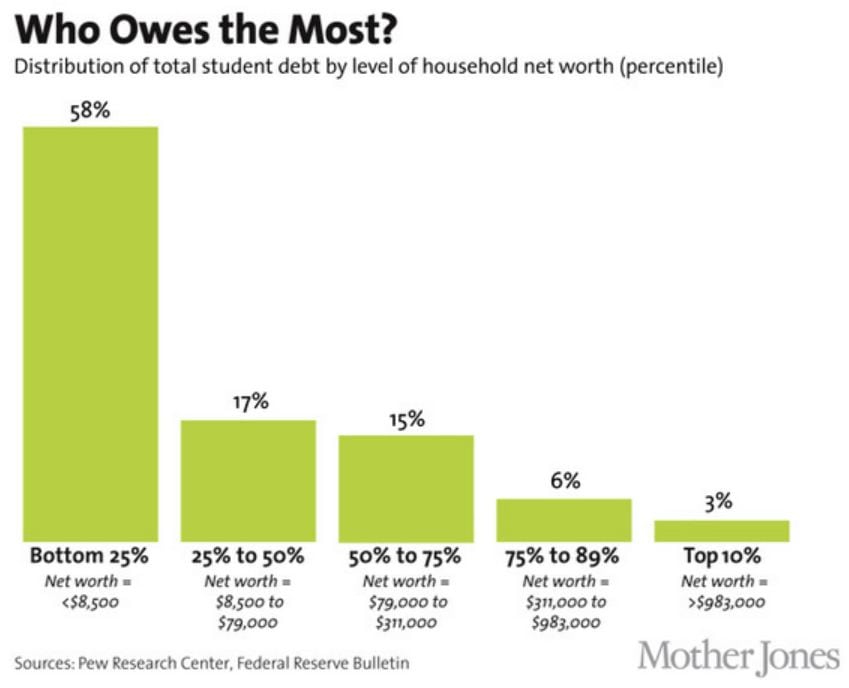
The Student Loan Debt Crisis in 9 Charts
Percentage of Adults Aged ≥65 Years Who Reported Excellent or Very Good Health,* by Selected Race/Ethnicity† and Poverty Status§ — National Health Interview Survey, 2009–2011
 CDC
CDC
Medicaid Expansion Would Help Veterans & Their Families
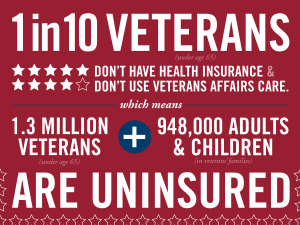 AARP
AARP
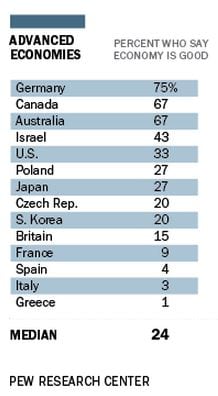
Economic Attitudes Across 39 Countries
Long term care
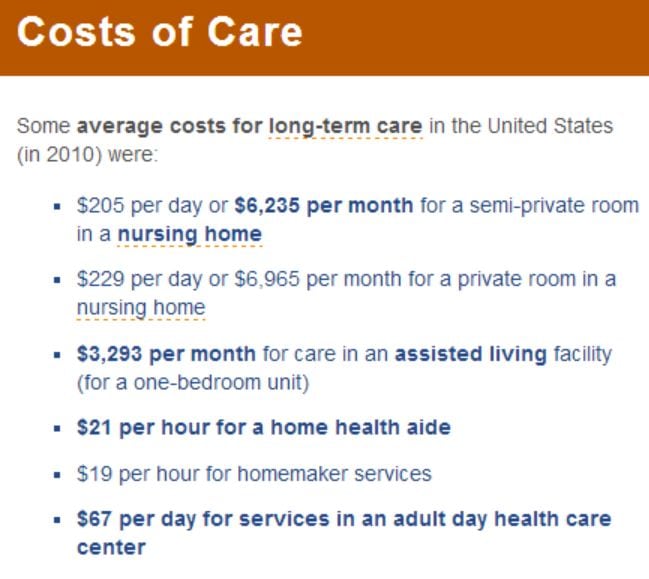 longtermcare.gov
Estimated Number of New HIV Infections Among Men Who Have Sex with Men, by Race/Ethnicity and Age at Infection, United States, 2010
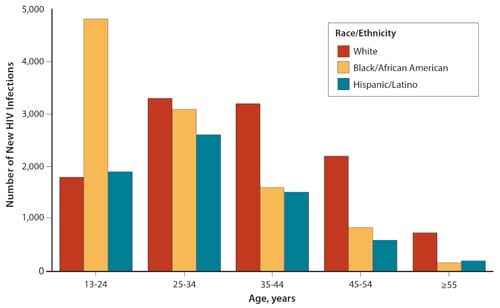 CDC
CDC
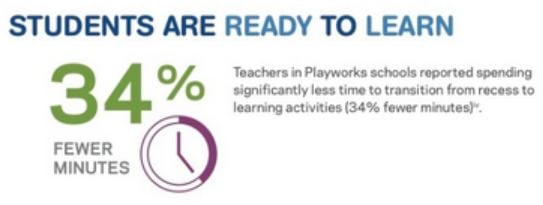
Infographic: Playworks Positive Findings From A Randomized Trial Evaluation
Banning Abortion Endangers Women’s Health
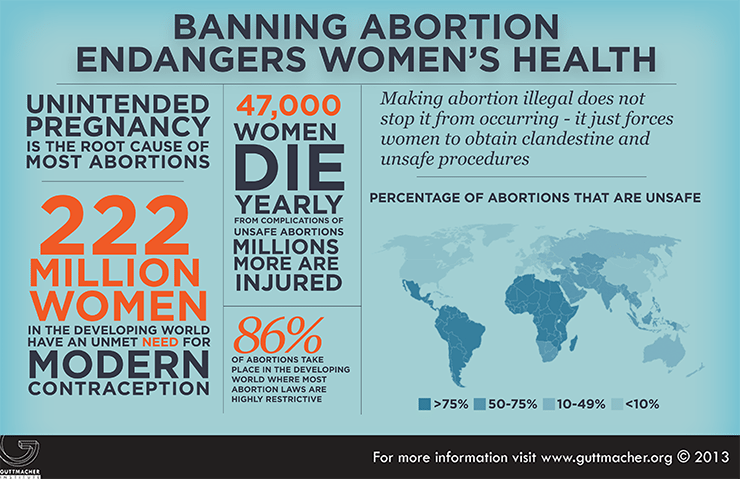 Guttmacher Institute
Chart 21. Boxplots showing WTE annual salaries for social workers
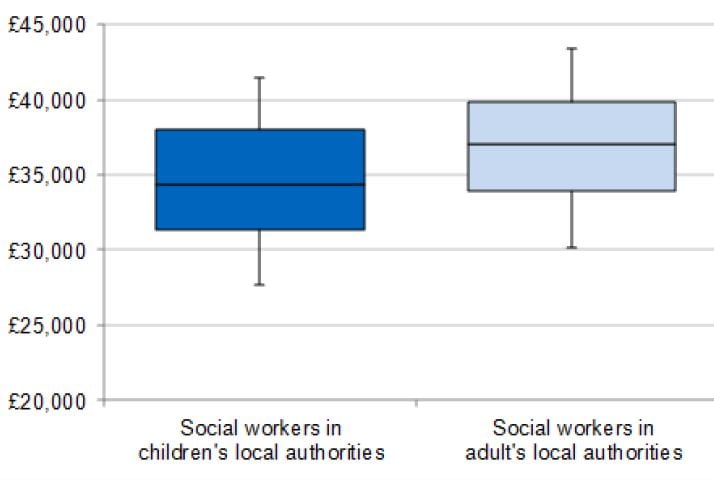 The Local Authority Children’s Social Care Services Workforce Report, December 2012, England
Teens Mix Prescription Opioids with Other Substances
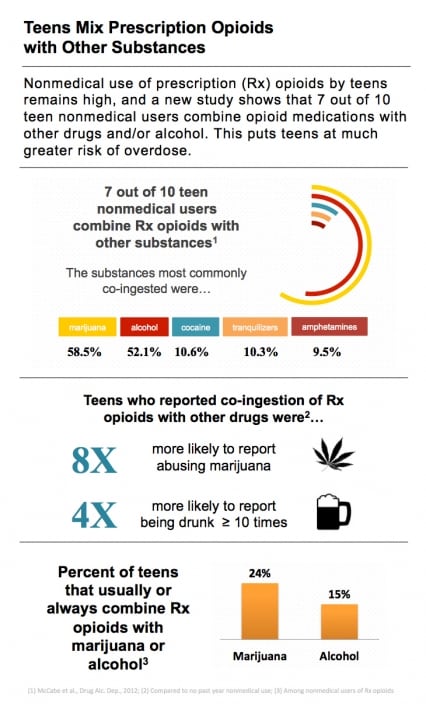 NIH/NIDA
Fact Sheet: The Decline in U.S. Fertility
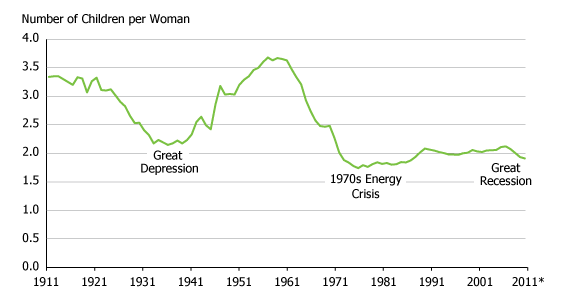 Population Reference Bureau.
Illicit drug use in America (2011)
 NIH/NIDA
SSI: Helping the Poorest Elderly and Disabled Americans
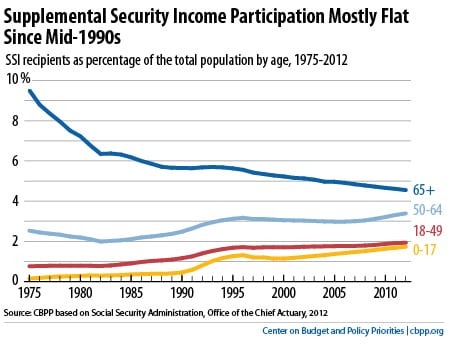 CBPP
CBPP
Synthetic Marijuana Lands Thousands of Young People in the ER, Especially Young Males
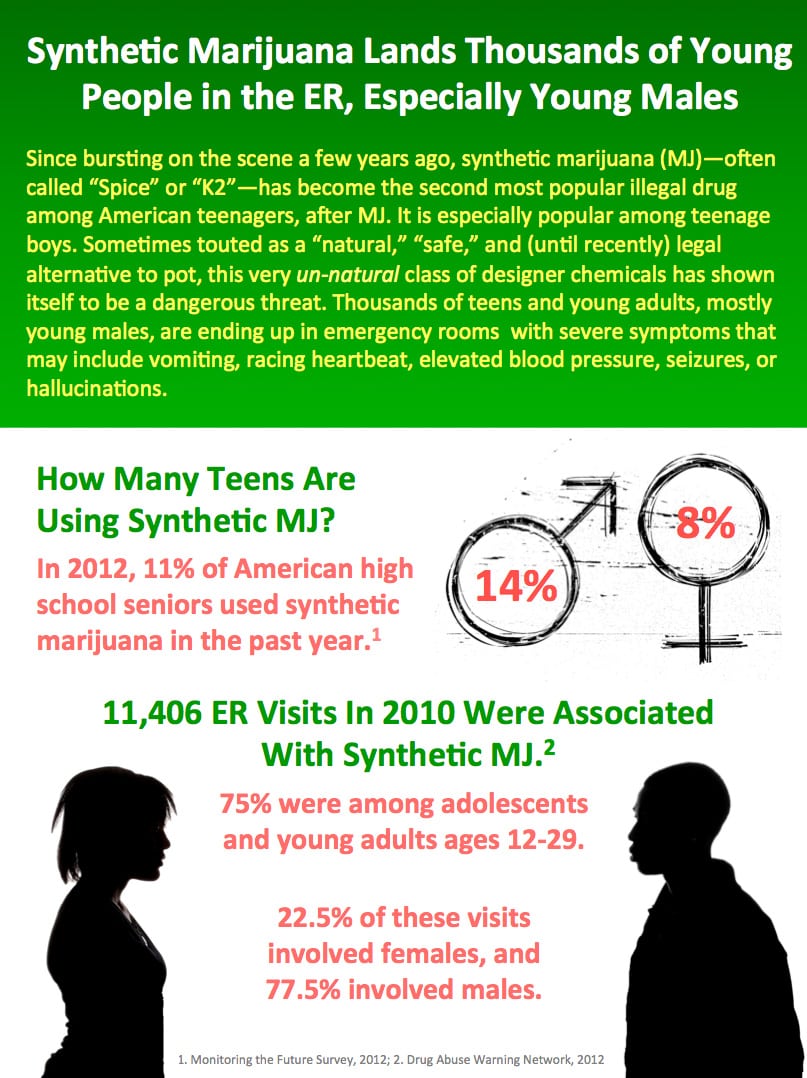 NIH/NIDA
Benefits of the Earned Income Tax Credit Extend to the Next Generation
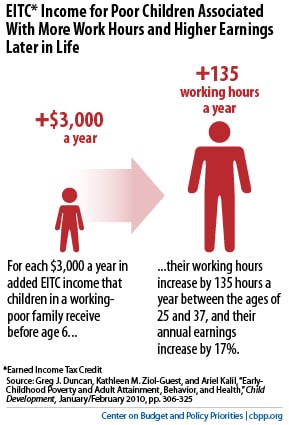 CBPP
CBPP
Use of Hearing Aids by Adults with Hearing Loss
 NIDCD
NIDCD
Age-sex-adjusted percentage of adults aged 18 and over who had ever been tested for human immunodeficiency virus (HIV), by race/ethnicity: United States, January–September 2012
 CDC/NCHS
Want More Low-Income Workers to Have Health Coverage? Expand Medicaid.
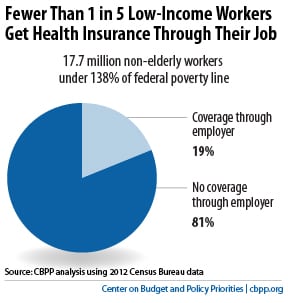 CBPP
CBPP
Supplemental Security Income (SSI) program
 SSA
SSA
Percent of Births Outside Marriage, 1960-2008/2011, Selected Countries
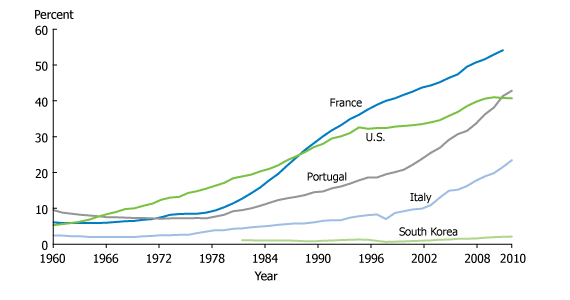 EUROSTAT, Council of Europe, U.S. National Center for Health Statistics, national statistical offices.
Social Security: Median income of aged units, by marital status (in 2010 dollars)
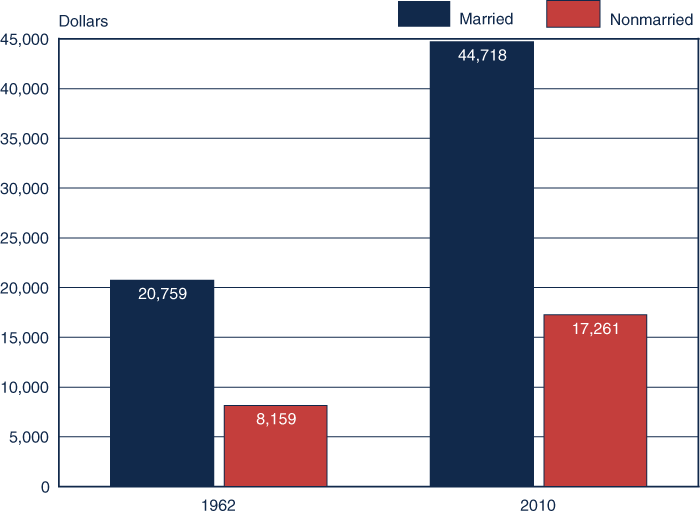 SSA
SSA
HIV/AIDS Among People Ages 15-49, by Gender (180 locations)
 PRB The World’s Women and Girls 2011 Data Sheet
How Social Security Is Financed
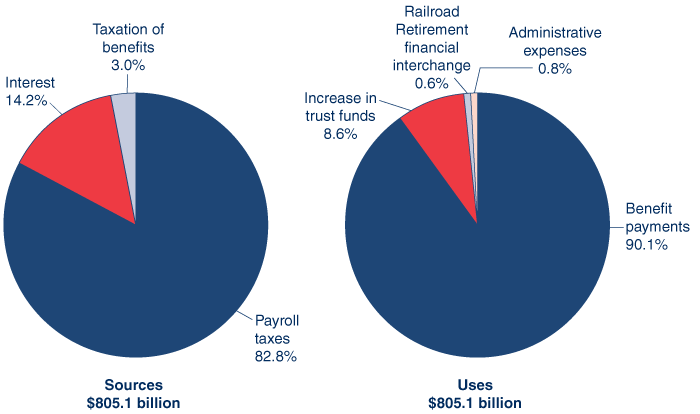 SSA
SSA
How Would the Chained CPI Affect Social Security Benefits?
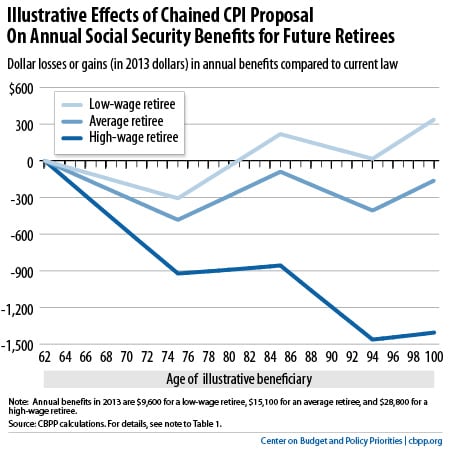 CBPP
CBPP
Fast Facts & Figures About Social Security, 2012 – All Beneficiaries, December 2011
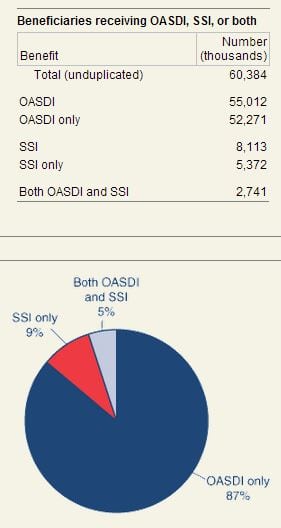 SSA
SSA
The Value of TANF Cash Benefits Continued to Erode in 2012
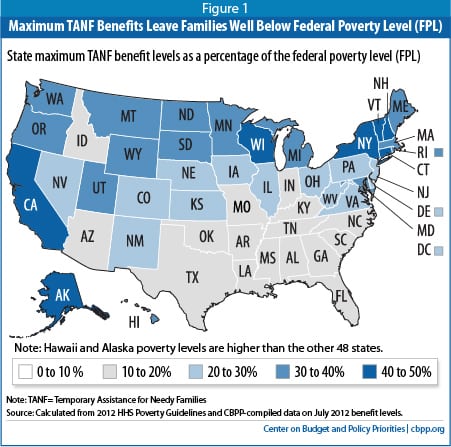 CBPP
CBPP
HIV/AIDS Among People Ages 15-49 (204 locations)
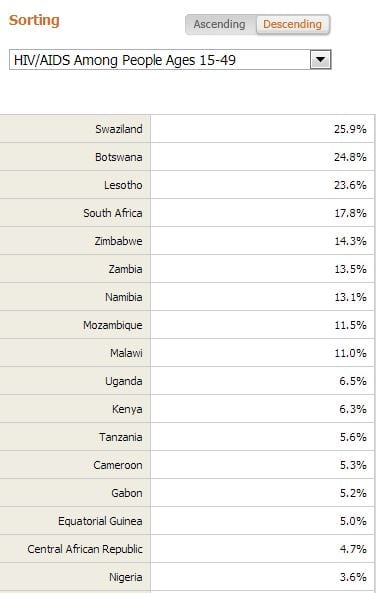 PRB 2011 World Population Data Sheet