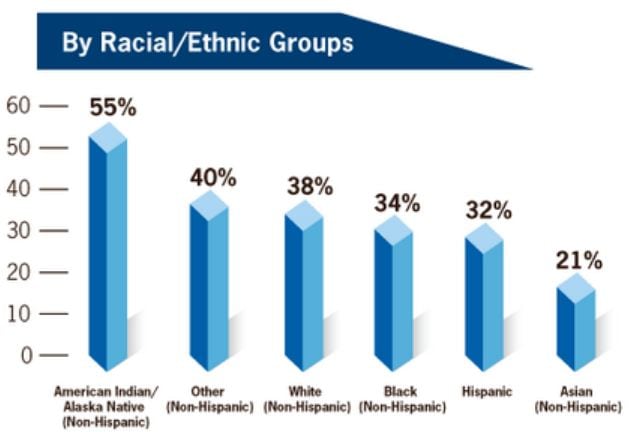
Adult Smoking: Focusing on People with Mental Illness
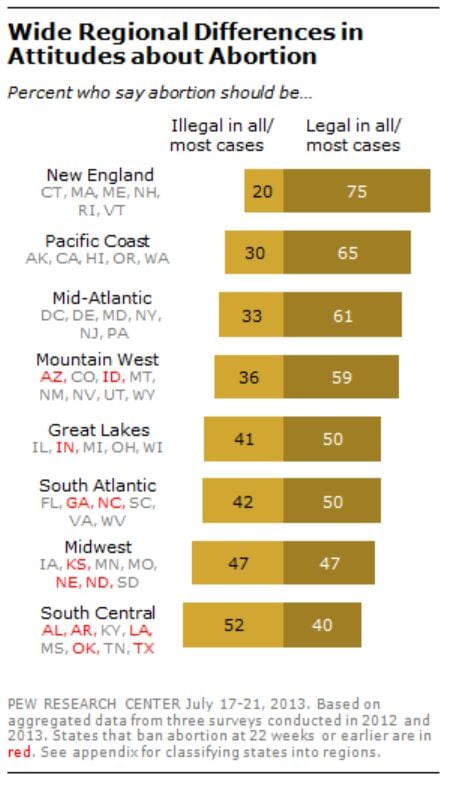
Widening Regional Divide on Abortion
Government Surveillance: A Question Wording Experiment
Photographic Series Showing What 200 Calories Looks Like in Different Foods
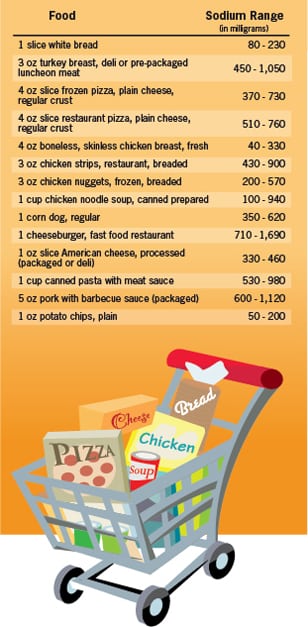
Where’s the sodium?
Stray prenatal gene network suspected in schizophrenia
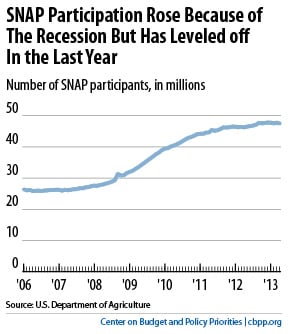
SNAP Enrollment Is Still High Because the Job Market Is Still Bad
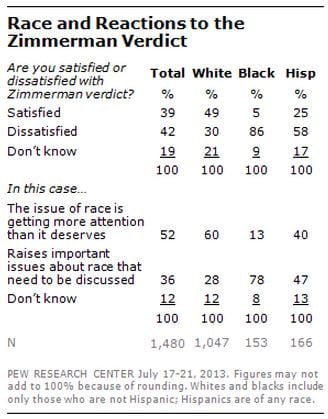
Big Racial Divide over Zimmerman Verdict
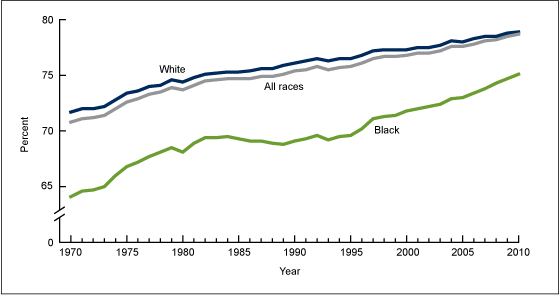
How Did Cause of Death Contribute to Racial Differences in Life Expectancy in the United States in 2010?
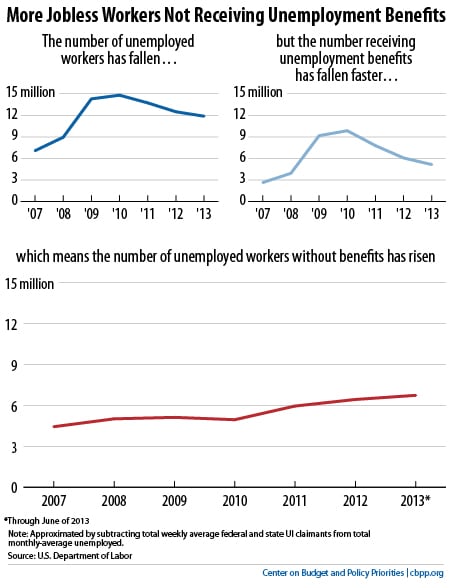
Unemployment’s Down, But More Unemployed Workers Lack Jobless Benefits
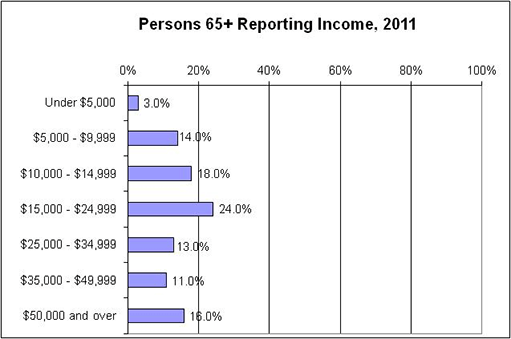
A Profile of Older Americans: 2012 – Income
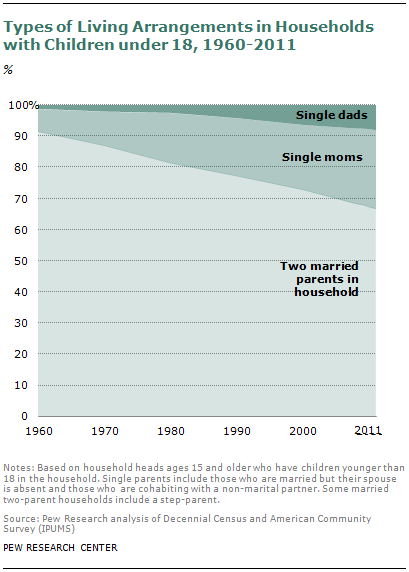
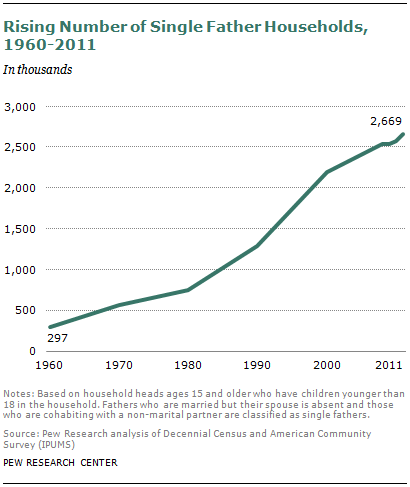
Rise of Single Fathers
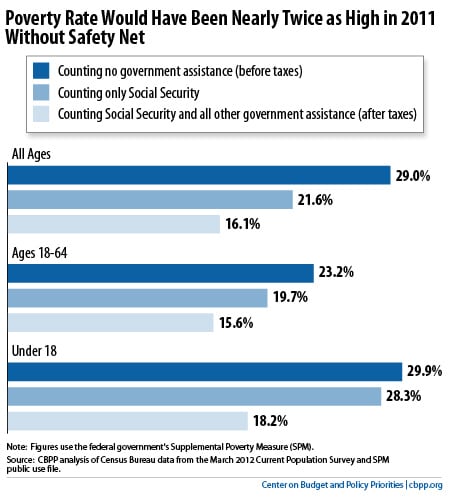
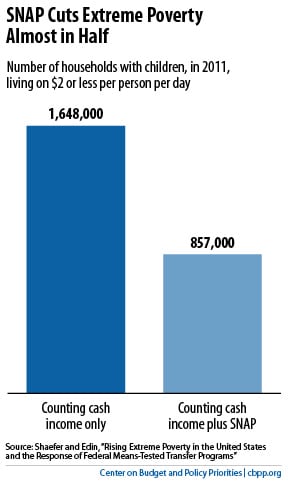
The Safety Net: Lifting Millions Out of Poverty
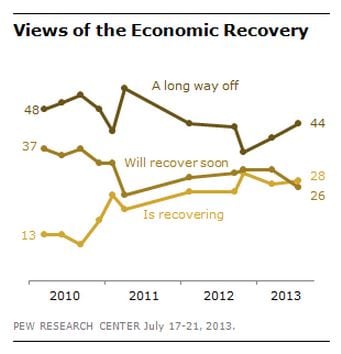
Many Say Economic Recovery Is Still a Long Way Off
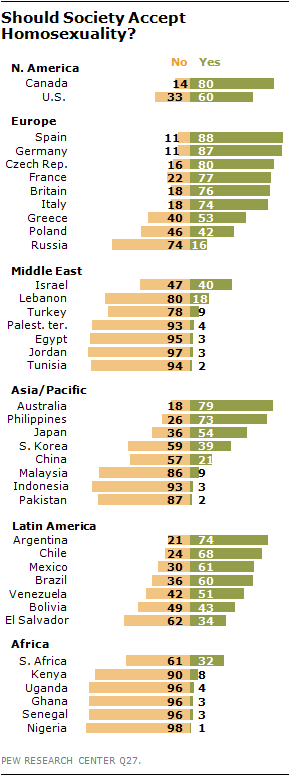
The Global Divide on Homosexuality
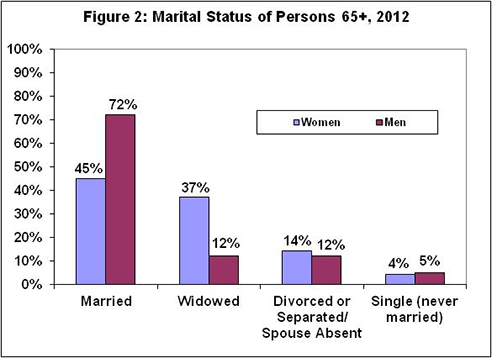
A Profile of Older Americans: 2012 – Marital Status
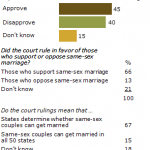
Recent court rulings
Recipe for Food Safety: Listeria
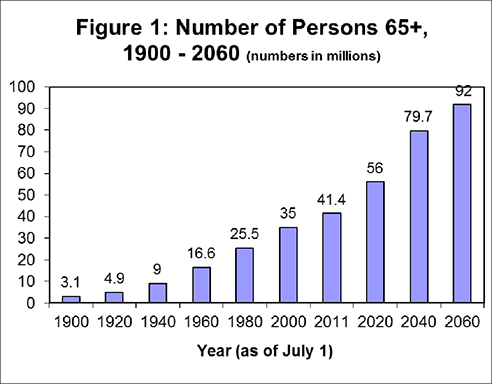
A Profile of Older Americans: 2012
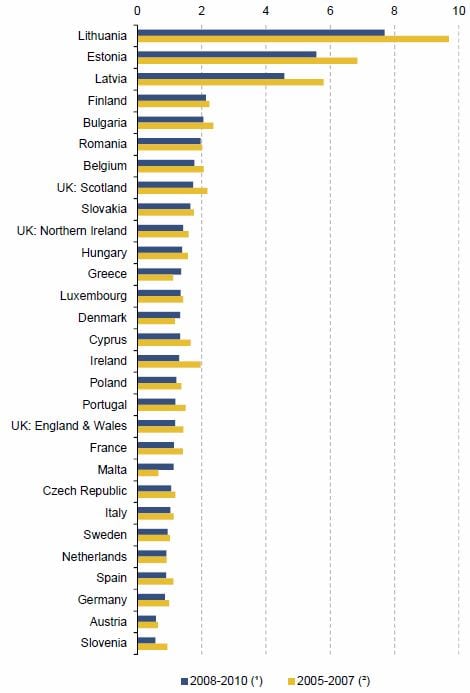
Figure 3: Homicide rate per 100 000 population, average per year, 2005-2007 and 2008-2010
Prescription Painkiller Overdoses
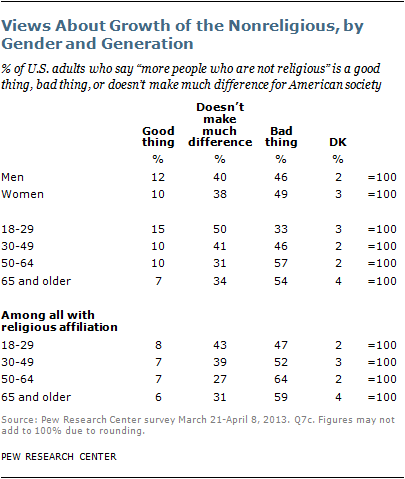
The Growth of the Nonreligious
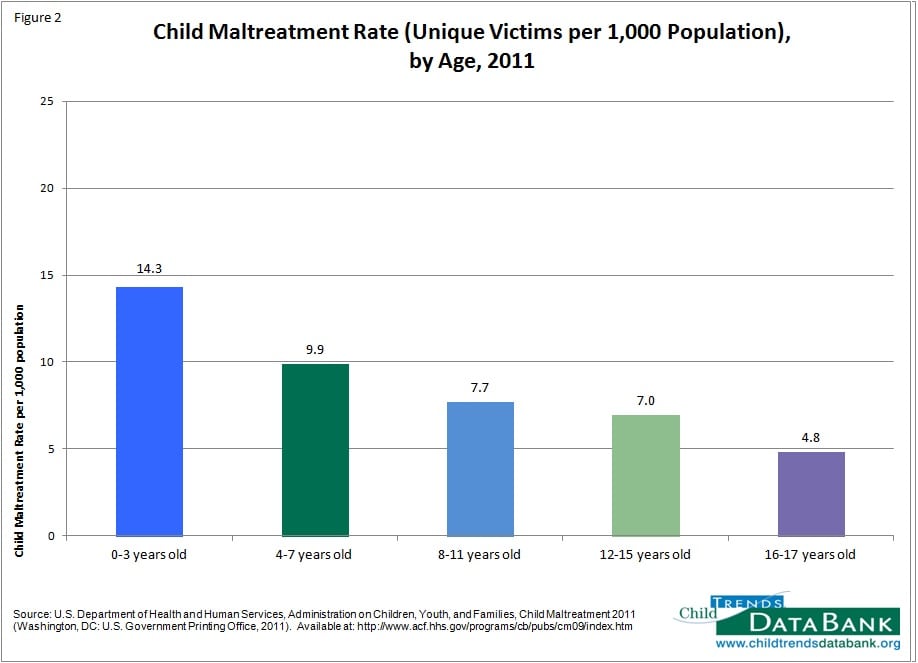
Child Maltreatment
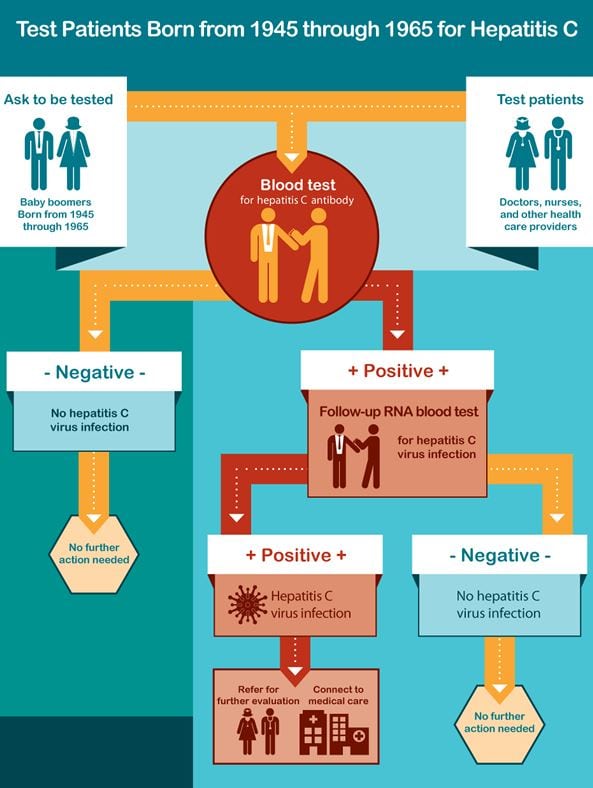
Hepatitis C
Only the richest 0.14 percent of estates pays any estate tax at all
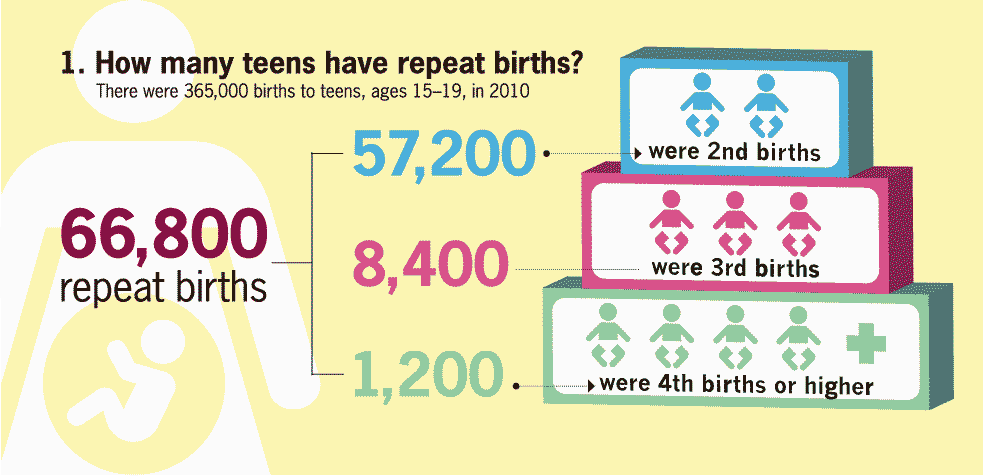
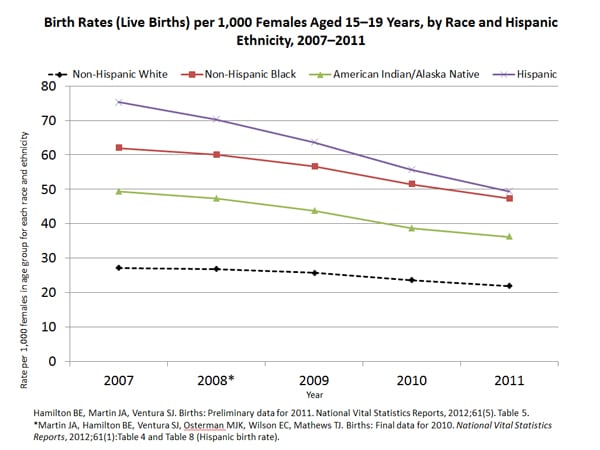
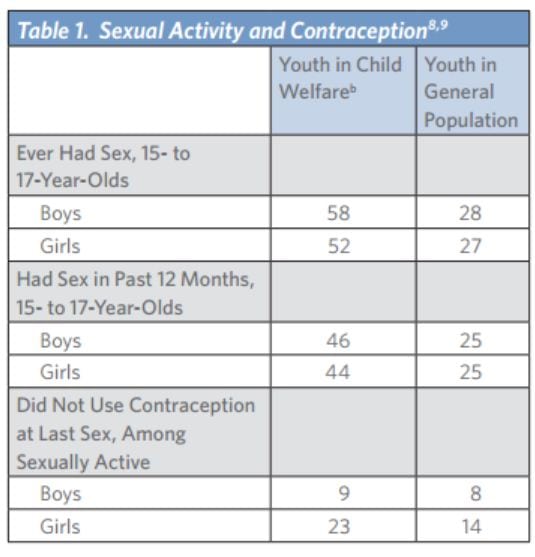
Preventing Repeat Teen Births
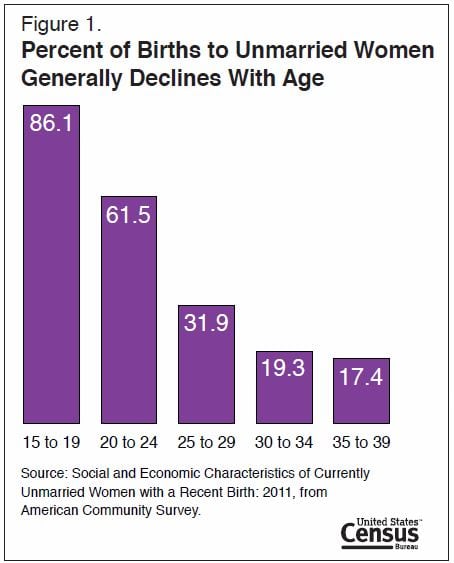
About 6 in 10 Recent Moms in Their Early 20s are Unmarried
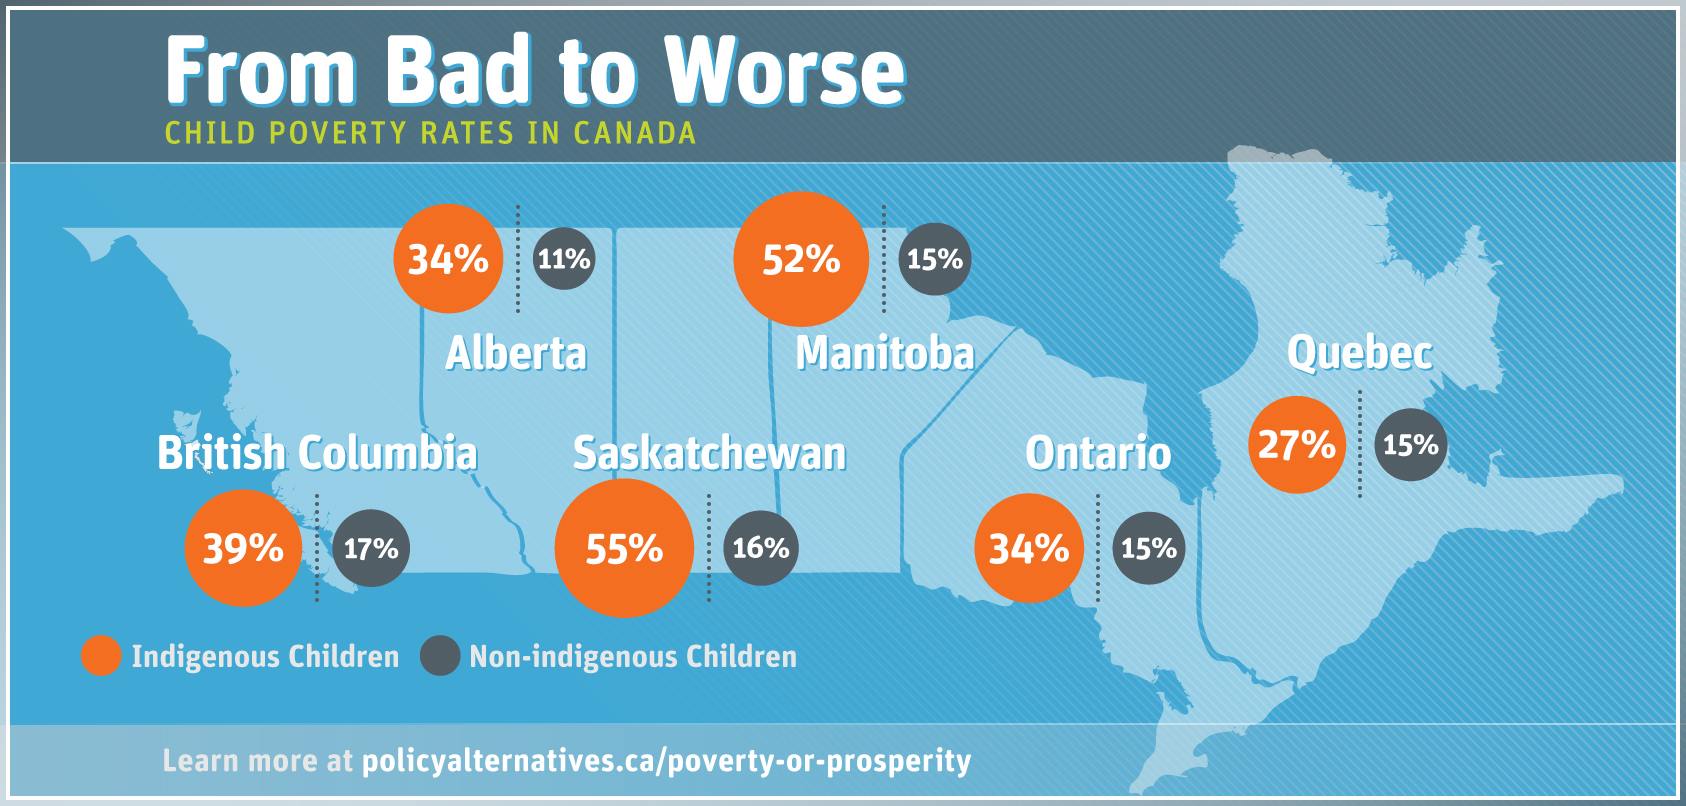
From Bad to Worse: Child Poverty Rates in Canada
The Los Angeles Homicide Report
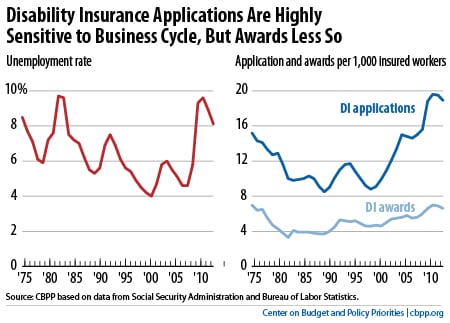
Latest Piece on Disability Insurance Doesn’t Tell the Full Story
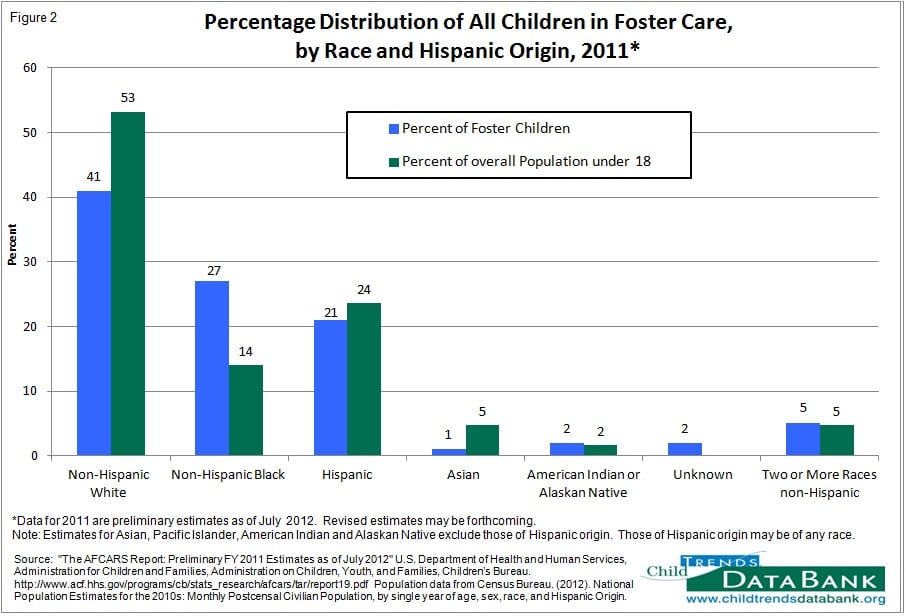
Foster Care
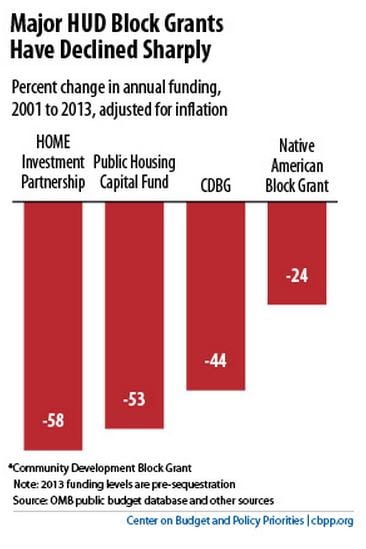
“Moving to Work” Compromise Would Cut Risk from Expanding Demonstration
The Rise of Single Fathers
North Carolina’s Obscene Attack on Jobless Benefits
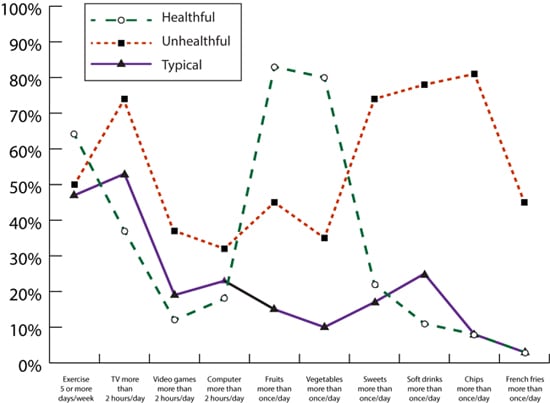
Only half of U.S. youth meet physical activity standards, NIH study shows
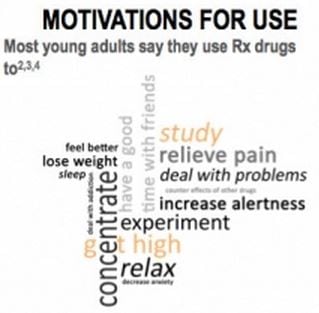
Abuse of Prescription (Rx) Drugs Affects Young Adults Most
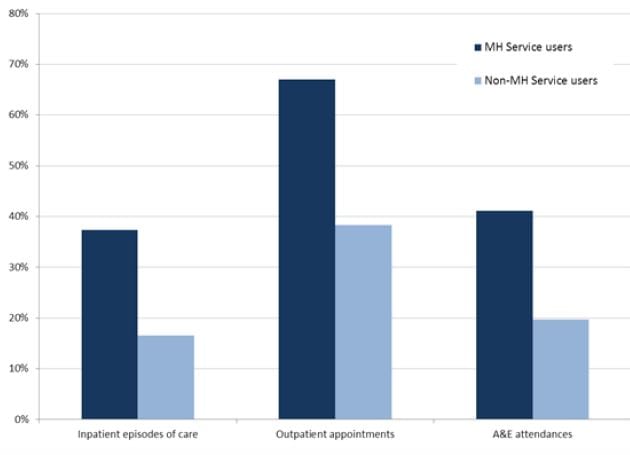
Hospital services: mental health service users have around double the attendance rate of general population
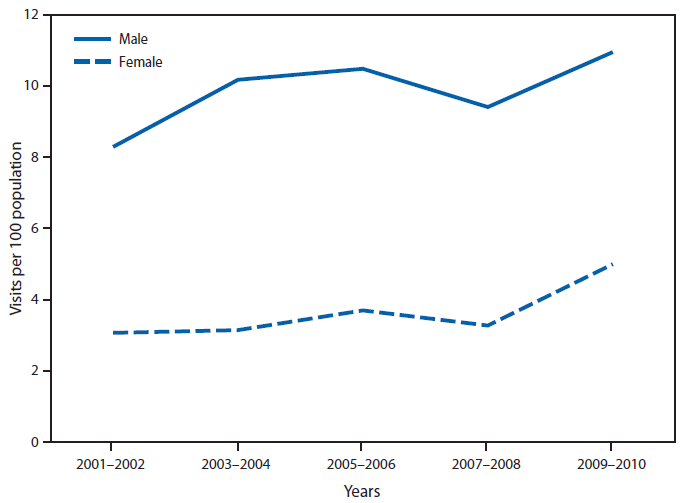
Rate of Ambulatory-Care Visits* for Attention Deficit Hyperactivity Disorder (ADHD)† by Persons Aged ≤18 Years, by Sex — United States, 2001–2002 to 2009–2010
Statistics on women’s smoking status at time of delivery: England, Quarter 4, 2012/13
In England in 2012/13:
– The percentage of mothers smoking at delivery was 12.7%, lower than 2011/12 (13.2%), 2010/11 (13.5%) and 2009/10 (14.0%)
– Amongst all Strategic Health Authorities (SHAs), this varied from 19.7% in the North East SHA to 5.7% in London SHA
– Amongst the 147 Primary Care Trusts (PCTs) that passed validation, smoking prevalence at delivery ranged from 30.8% in Blackpool PCT to 2.3% in Westminster PCT

