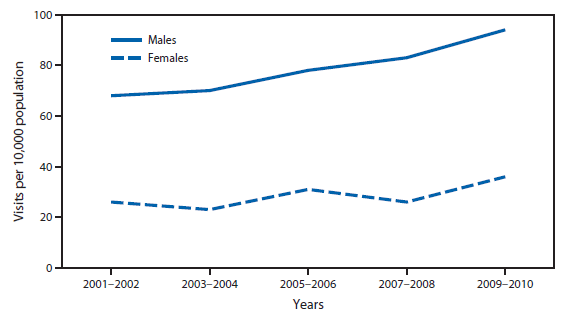
Rate of Emergency Department Visits for Alcohol-Related Diagnoses, by Sex — National Hospital Ambulatory Medical Care Survey, United States, 2001–2002 to 2009–2010
Children and Guns: The Hidden Toll
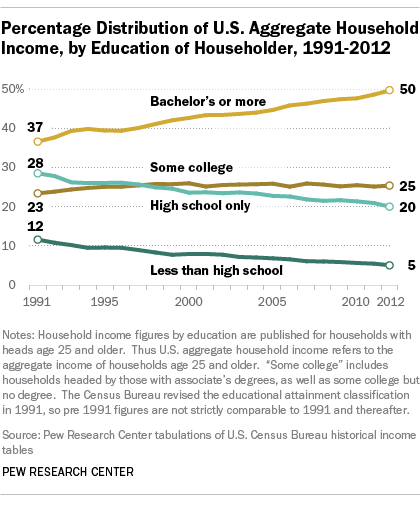
The growing economic clout of the college educated
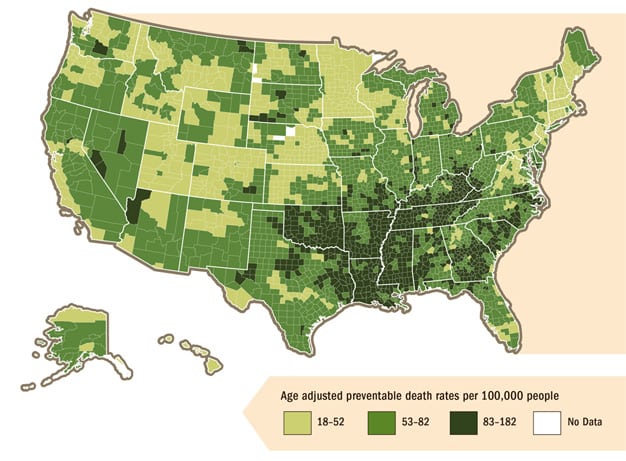
Preventable Deaths from Heart Disease & Stroke
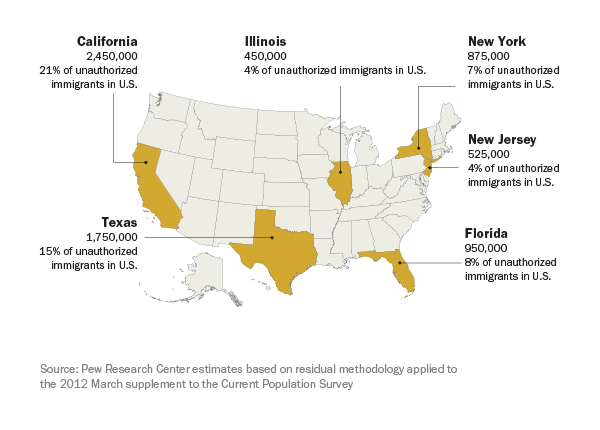
These six states were home to 60% of unauthorized immigrants in 2012
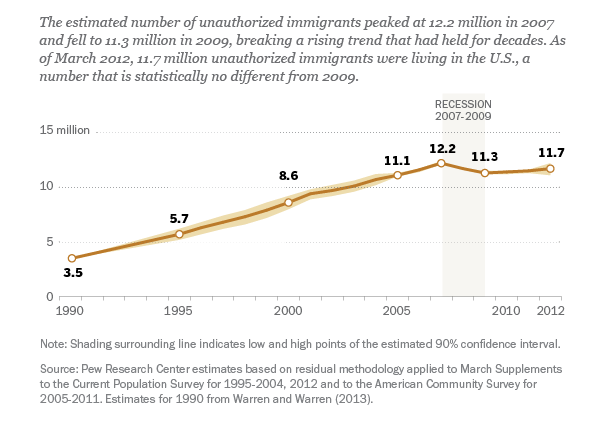
Interactive: U.S. Unauthorized Immigration Trends
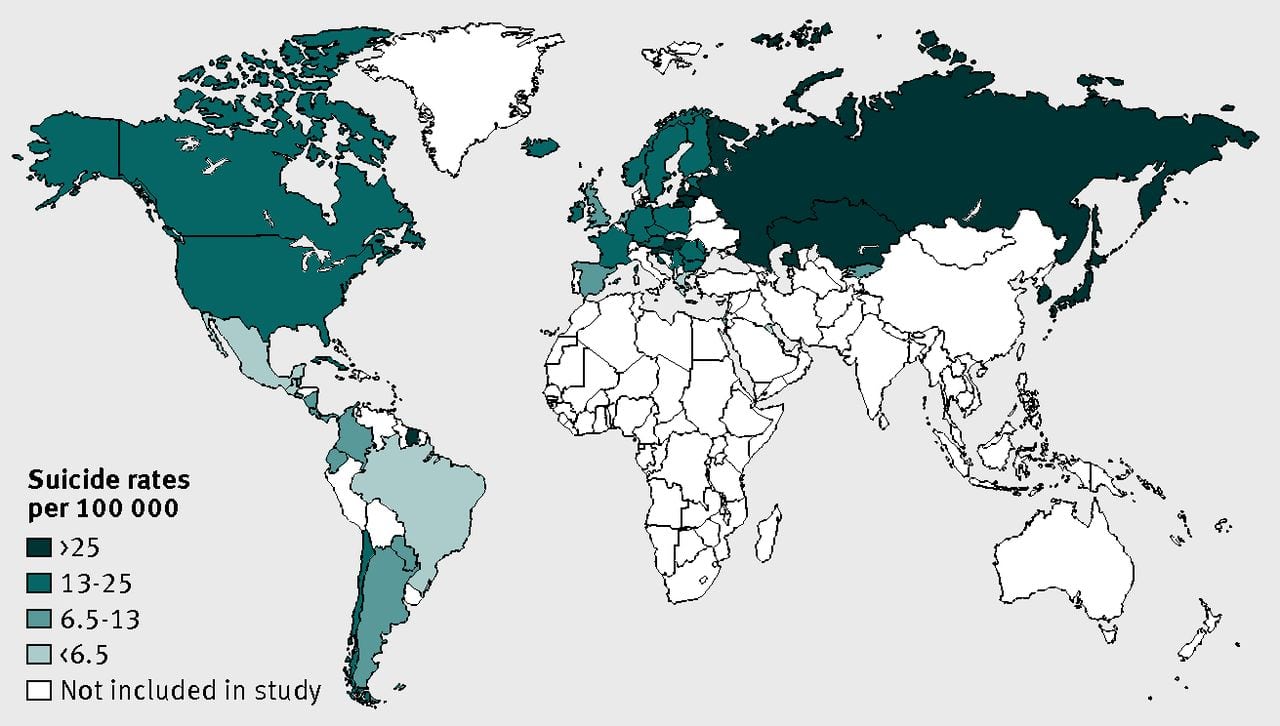
Impact of 2008 global economic crisis on suicide: Time trend study in 54 countries
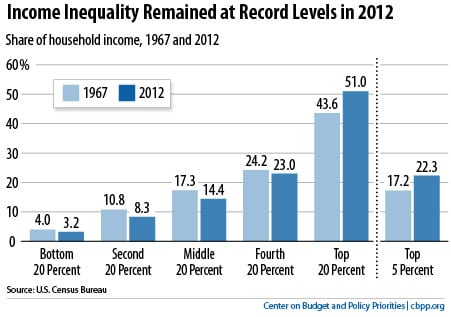
Things We Learned From Census About Poverty, Income, and Health Insurance
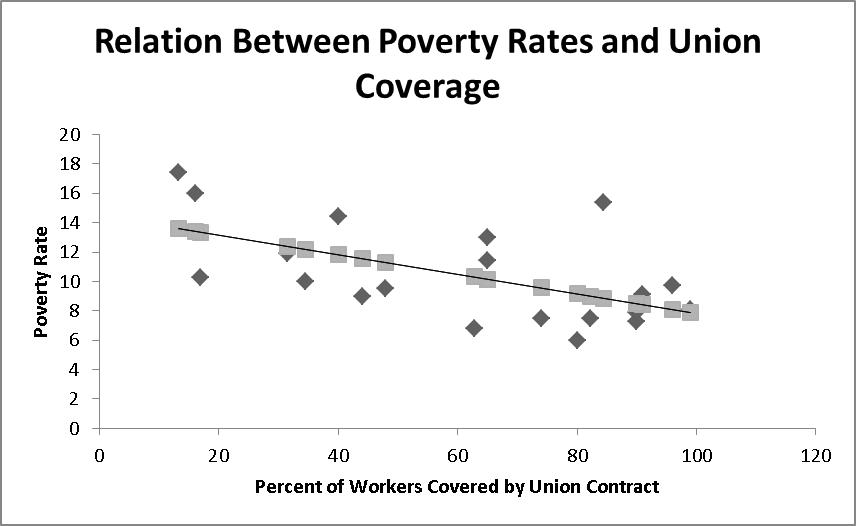
Unions: The Best Fix to Poverty
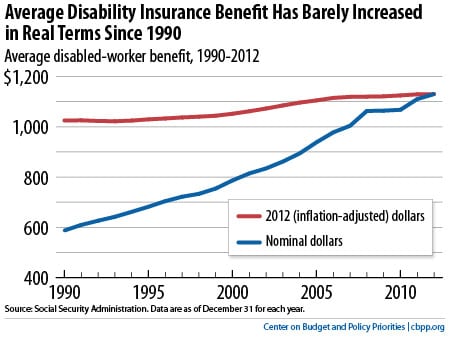
The Economist Gets It Wrong on Disability Insurance
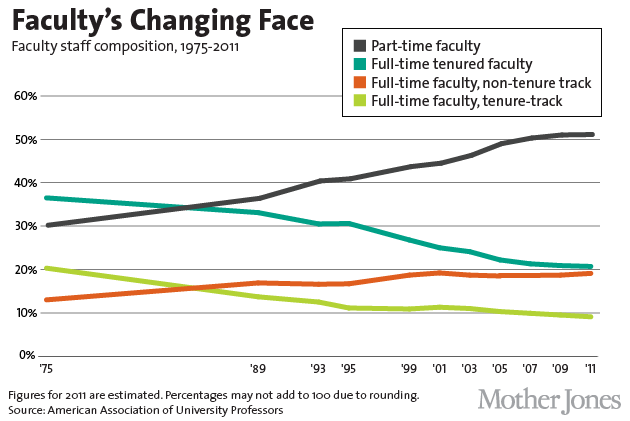
A part-time professor with a master’s degree teaching eight courses makes about $19,200 annually
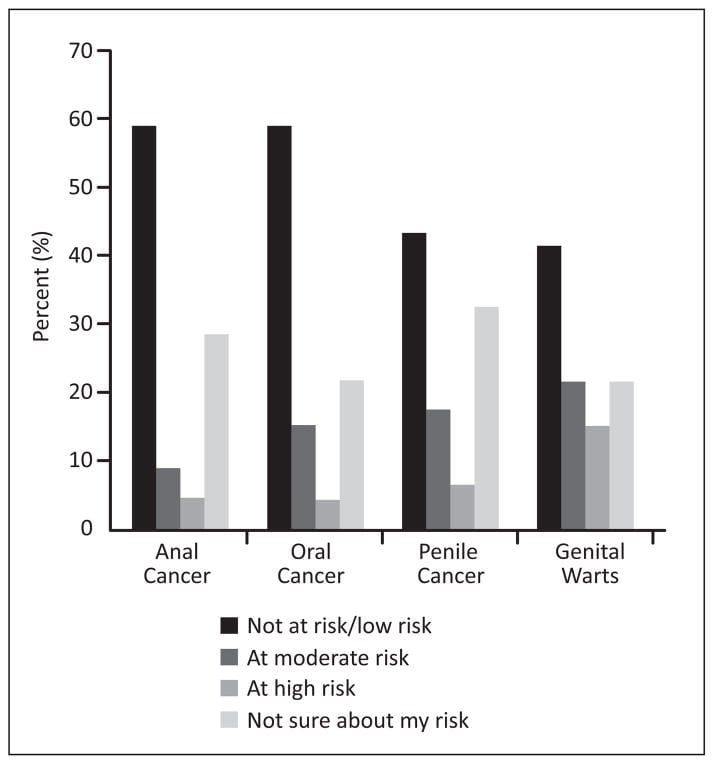
HPV awareness and willingness to HPV vaccination among high-risk men attending an STI clinic in Puerto Rico.
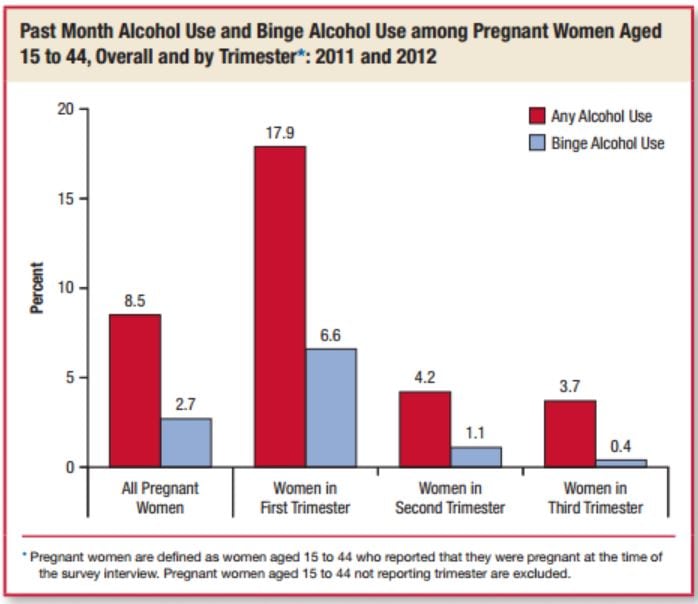
18 Percent of Pregnant Women Drink Alcohol during Early Pregnancy
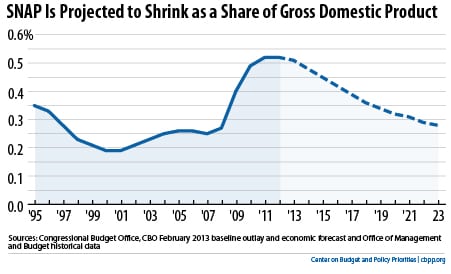
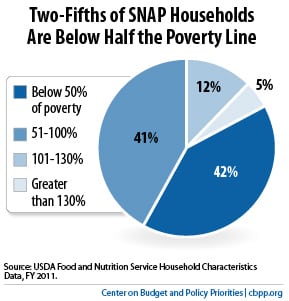
Setting the Record Straight on SNAP, Part 5: SNAP Will Shrink as the Economy Improves
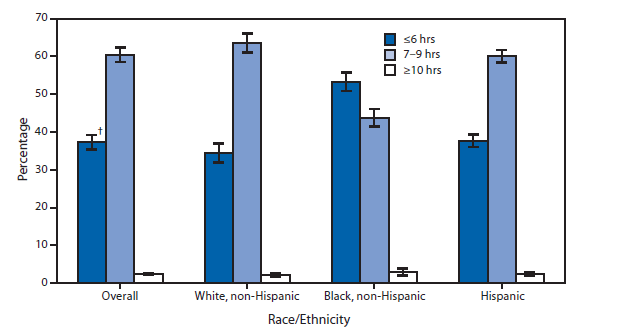
Sleep Duration* Among Adults Aged ≥20 Years, by Race/Ethnicity — National Health and Nutrition Examination Survey, United States, 2007–2010
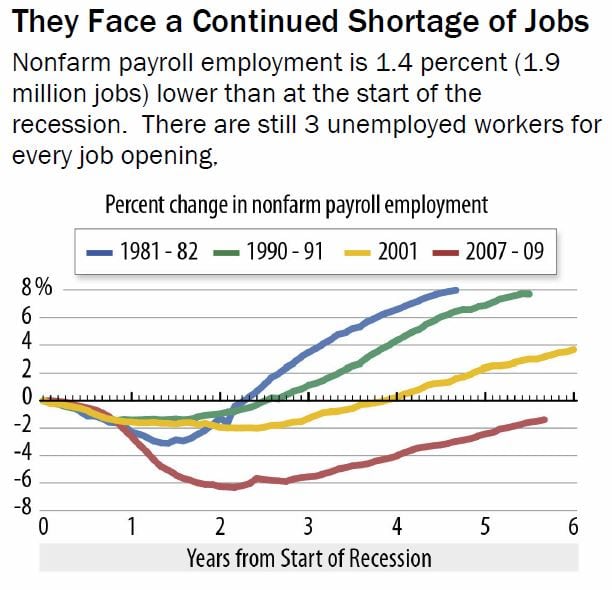
Setting the Record Straight on SNAP, Part 4: Weak Job Market Keeping SNAP Enrollment High
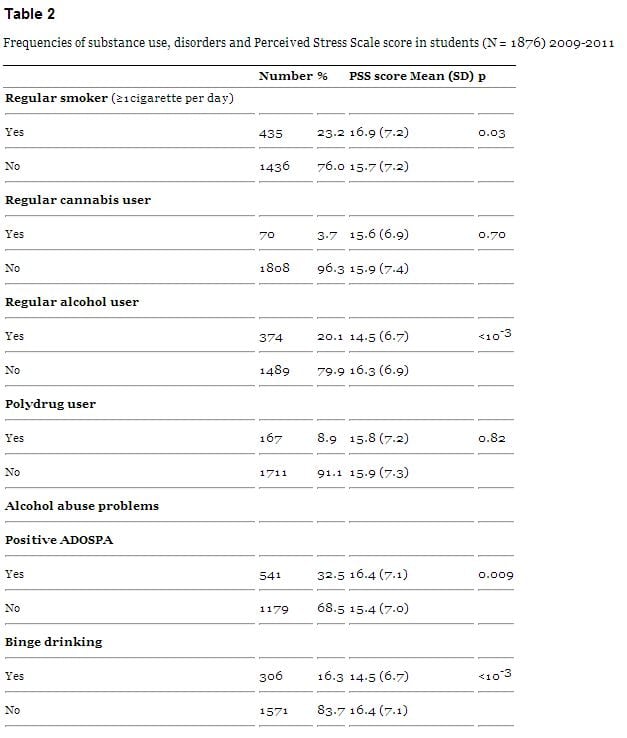
Prevalence and association of perceived stress, substance use and behavioral addictions: a cross-sectional study among university students in France, 2009–2011
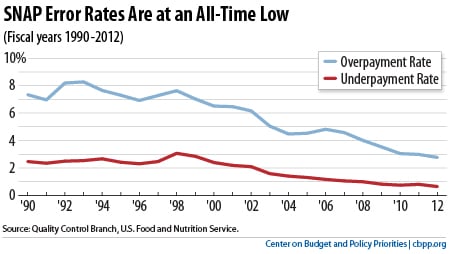
Setting the Record Straight on SNAP, Part 3: Waving the “Fraud, Waste, and Abuse” Flag
Setting the Record Straight on SNAP, Part 2: The Truth About Unemployed Childless Adults
Setting the Record Straight on SNAP, Part 1: Overview
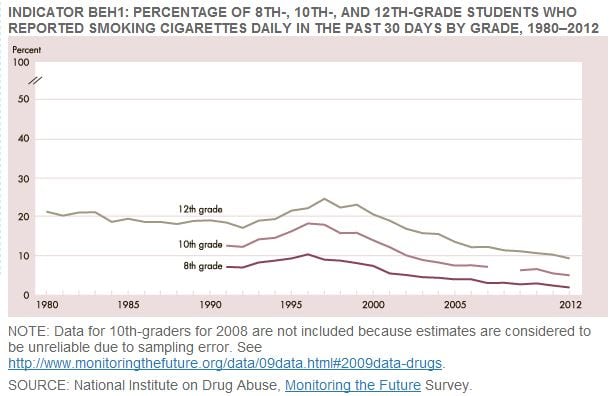
Regular Cigarette Smoking
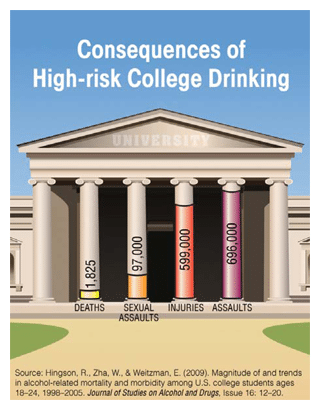
Fall Semester—A Time for Parents to Revisit Discussions About College Drinking
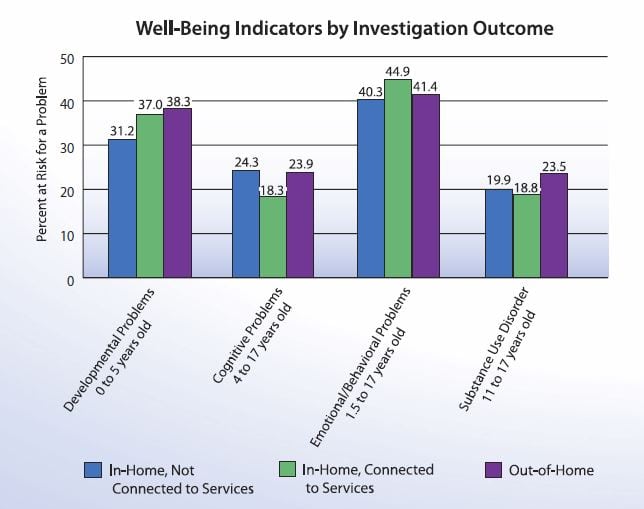
Child Well-Being Spotlight: Children Placed Outside the Home and Children Who Remain In-Home After a Maltreatment Investigation Have Similar and Extensive Service Needs
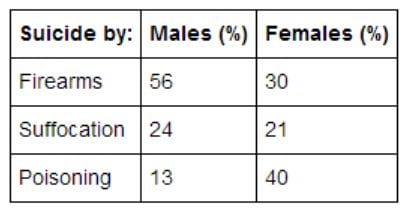
Suicide in the U.S.: Statistics and Prevention
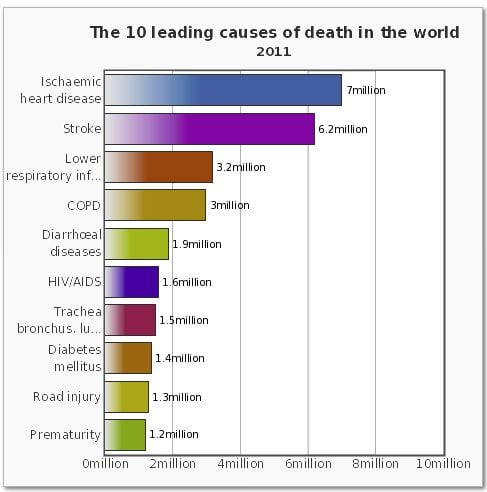
The top 10 causes of death
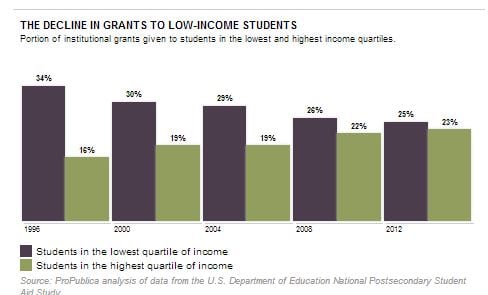
Public Universities Ramp Up Aid for the Wealthy, Leaving the Poor Behind
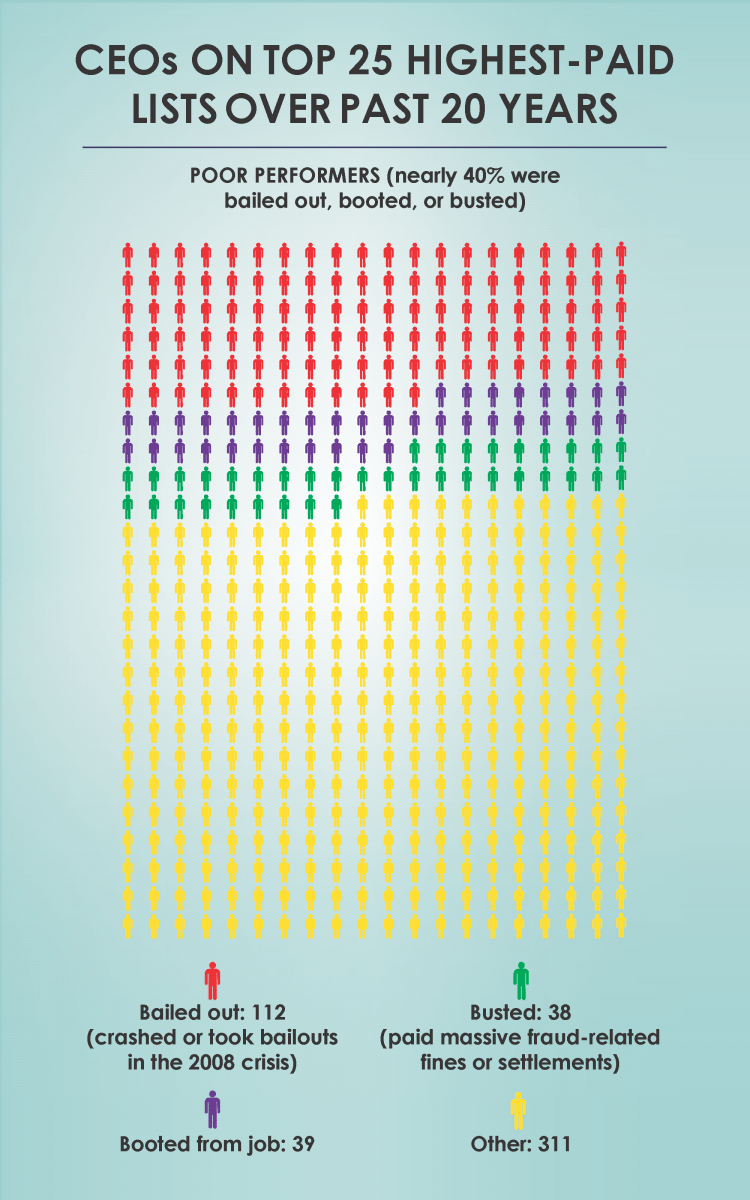
Paying CEOs Top Dollar for Poor Performance
 The Nation | Institute for Policy Studies
These cases of gross overcompensation for poor performance seem exceptional, but in fact they’re representatives of a trend. A twenty-year review released today by the Institute for Policy Studies found that the records of nearly 40 percent of America’s top-earning executives include leading their firms to bankruptcy, government bailouts, fraud-related fines and settlements, and their own firing.
