% of cell phone users who use their phone to send or receive text messages. No indication of whether or not engaging in this behavior results in any meaningful improvement to one’s life (e.g., costs vs benefits).
Food Hardship Rate in 2010-2011 by Congressional District
US State Rankings: Heatlh and Wellness
12-month prevalence of DSM-IV/WMH-CIDI disorders by sex and cohort 1 (n=9282)
https://www.hcp.med.harvard.edu/ncs/
1This table includes updated data as of July 19, 2007. Updates reflect the latest diagnostic, demographic and raw variable information.
2 Assessed in the Part II sample (n = 5692).
3 Assessed in a random one-third of the Part II sample (n = 2073).
4 Assessed in the Part II sample among respondents in the age range 18-44 (n = 3197).
5 Estimated in the Part II sample. No adjustment is made for the fact that one or more disorders in the category were not assessed for all Part II respondents.
6 The estimated prevalence of any impulse-control disorder is larger than the sum of the individual disorders because the prevalence of intermittent explosive disorder, the only impulsecontrol
disorder that was assessed in the total sample, is reported here for the total sample rather than for the sub-sample of respondents among whom the other impulse-control disorders
were assessed (Part II respondents in the age range 18-44). The estimated prevalence of any impulse-control disorder, in comparison, is estimated in the latter sub-sample. Intermittent
explosive disorder has a considerably higher estimated prevalence in this sub-sample than in the total sample.
7 Disorder with hierarchy
More People Walk to Better Health
11.1 Million Unauthorized Immigrants Were Living in the U.S. in 2011
DHAP Annual Report: Accelerating Progress, Investing for Impact
Teachers Say that for Students Today ‘Research = Googling’
The Research SUPPLEMENTAL POVERTY MEASURE: 2011
US: Economic opportunity by state
Unemployment Rates by Education, 2007-2012
Pro–’Right to Work’ Groups In Michigan Outspend Union Counterparts
Housing Cost as a Percentage of Income for Households with Children
Better Transportation Options = Healthier Lives
Nonprofits and the Economy
Seniors’ Reported Sources of Information About Medicare Drug Benefit
Most Americans Believe Failure to Avoid Fiscal Cliff Would Have a Major Impact
Lifetime prevalence of DSM-IV/WMH-CIDI disorders by sex and cohort (n=9282)
https://www.hcp.med.harvard.edu/ncs/
1 This table includes updated data as of July 19, 2007. Updates reflect the latest diagnostic, demographic and raw variable information.
2 Assessed in the Part II sample (n = 5692).
3 Assessed in a random one-third of the Part II sample (n = 2073).
4 Assessed in the Part II sample among respondents in the age range 18-44 (n = 3197).
5 Estimated in the Part II sample. No adjustment is made for the fact that one or more disorders in the category were not assessed for all Part II respondents.
6 Disorder with hierarchy
Gap Between Need and Availability of Affordable Units for Poor Renters
Child Injury
United States Cancer Statistics: Top Ten Cancers 2004-2008 Women
Many Americans Don’t Fully Understand Fiscal Cliff Impact
Number of Poor Rental Households and Available Affordable Units
Breast Cancer
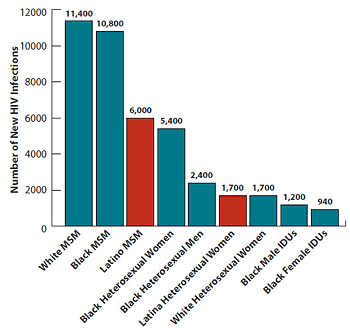
Number of new HIV Infections among youth by sex and race/ethnicity—United States, 2010
HIV Among Youth in the US
History Of Automatic Cost-Of-Living Adjustments: Social Security in US
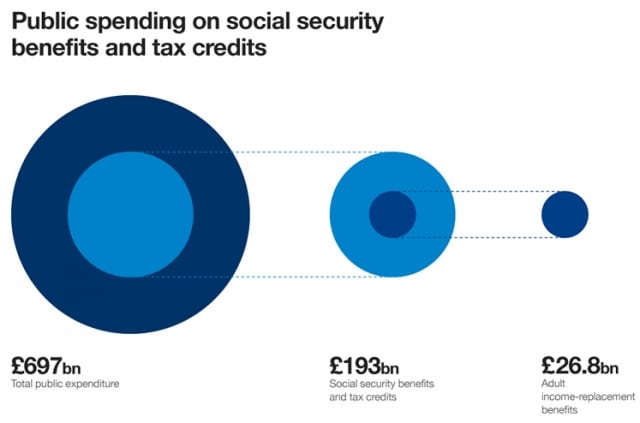
The UK poverty line
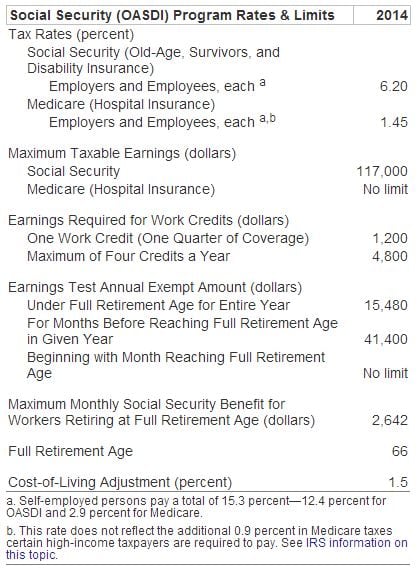
Fast Facts & Figures About Social Security, 2012
Did You Know That…
– SSA paid benefits to about 60.4 million people in 2011
– Social Security provided at least half the income for 65 percent of the aged beneficiaries in 2010

– Social Security benefits were awarded to about 5.6 million people in 2011
– Women accounted for 56 percent of adult Social Security beneficiaries in 2011
– The average age of disabled-worker beneficiaries was 53.0 in 2011
– Eighty-five percent of SSI recipients received payments because of disability or blindness in 2011
Big Political Divide on Proposals to Raise Taxes on Wealthy
Nearly Half Support Legalization of Marijuana
Prescription Painkiller Overdoses: Use and Abuse of Methadone as a Painkiller
Broad Concern about ‘Fiscal Cliff’ Consequences
EU Member states granted citizenship to more than 800 000 persons in 2010 – Issue number 45/2012
Teen Drinking and Driving: A Dangerous Mix
Key Welsh Economic Statistics – November 2012
Wide and Growing Income Gaps in Most States
Latinos Express Growing Confidence In Personal Finances, Nation’s Direction
Number of SSI Recipients, 1974–2011
Most Americans See China as a Competitor
Behind Gay Marriage Momentum, Regional Gaps Persist
Number of Americans with Mobile Connections to the Web on the Rise
Size of Income, 1962 and 2010
SOURCES: Data for 1962 are from Social Security Administration, The Aged Population of the United States: The 1963 Social Security Survey of the Aged (1967). Data for 2010 are Social Security Administration calculations from the March 2011 Annual Social and Economic Supplement to the Current Population Survey.
Risk of relative poverty of men and women by age, OECD average, 2008
Most in China See Growing Income Inequality
Statistics on NHS Stop Smoking Services: England, April 2012 to June 2012
Key Facts
• 176,945 people set a quit date through NHS Stop Smoking Services, a decrease of 17% (35,363) on the final figure for same period in 2011/12 (212,308), and an decrease of 7% (13,473) on the final figure for the same period in 2010/11 (190,418).
• At the 4 week follow-up 86,341 people had successfully quit (based on self-report), 49% of those setting a quit date. This is a decrease of 15% (15,214) on the final figure for the same period in 2011/12 (101,555), and also a decrease of 3% (3,074) on the final figure for the same period in 2010/11 (89,415).