Percentage of Adults Who Used Selected Complementary Health Approaches* in the Preceding 12 Months, by Metropolitan Status of Residence† — National Health Interview Survey,§ United States, 2012
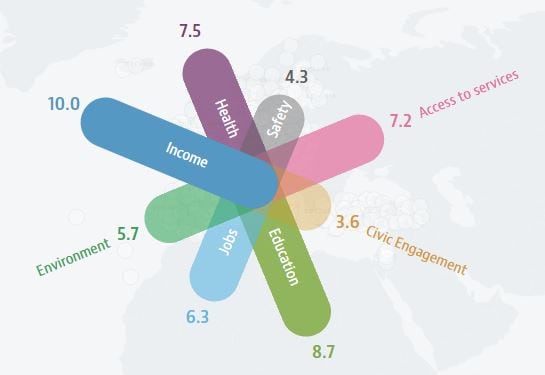
OECD regional well-being – US: New York (interactive – check your locale)
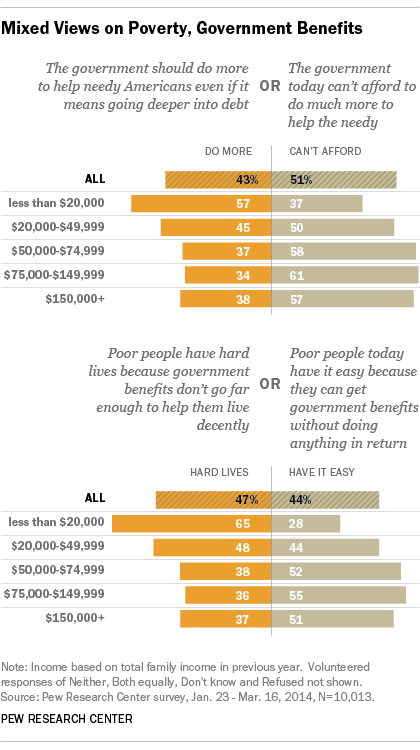
Public is sharply divided in views of Americans in poverty
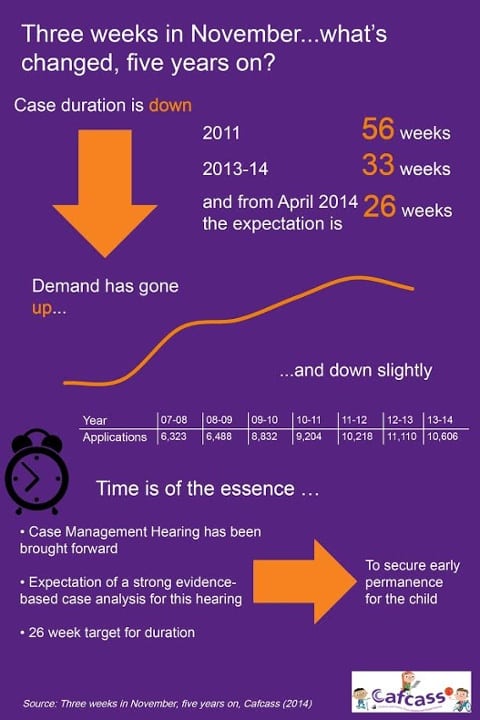
Social workers have coped well with significant changes to practice
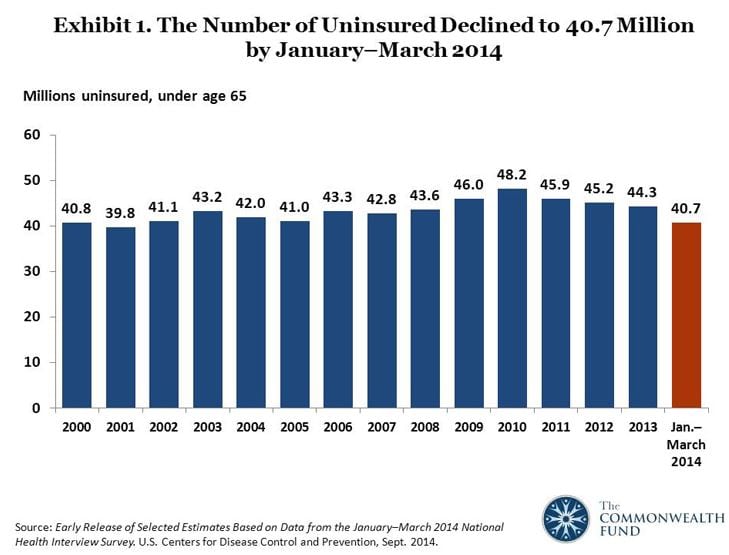
New Federal Surveys Show Declines in Number of Uninsured Americans in Early 2014
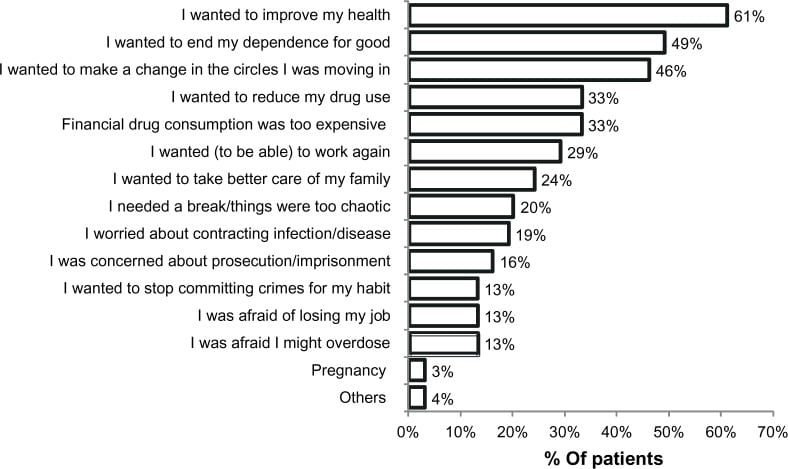
The current status of opioid maintenance treatment in France: a survey of physicians, patients, and out-of-treatment opioid users
Drug-poisoning Deaths Involving Opioid Analgesics: United States, 1999–2011

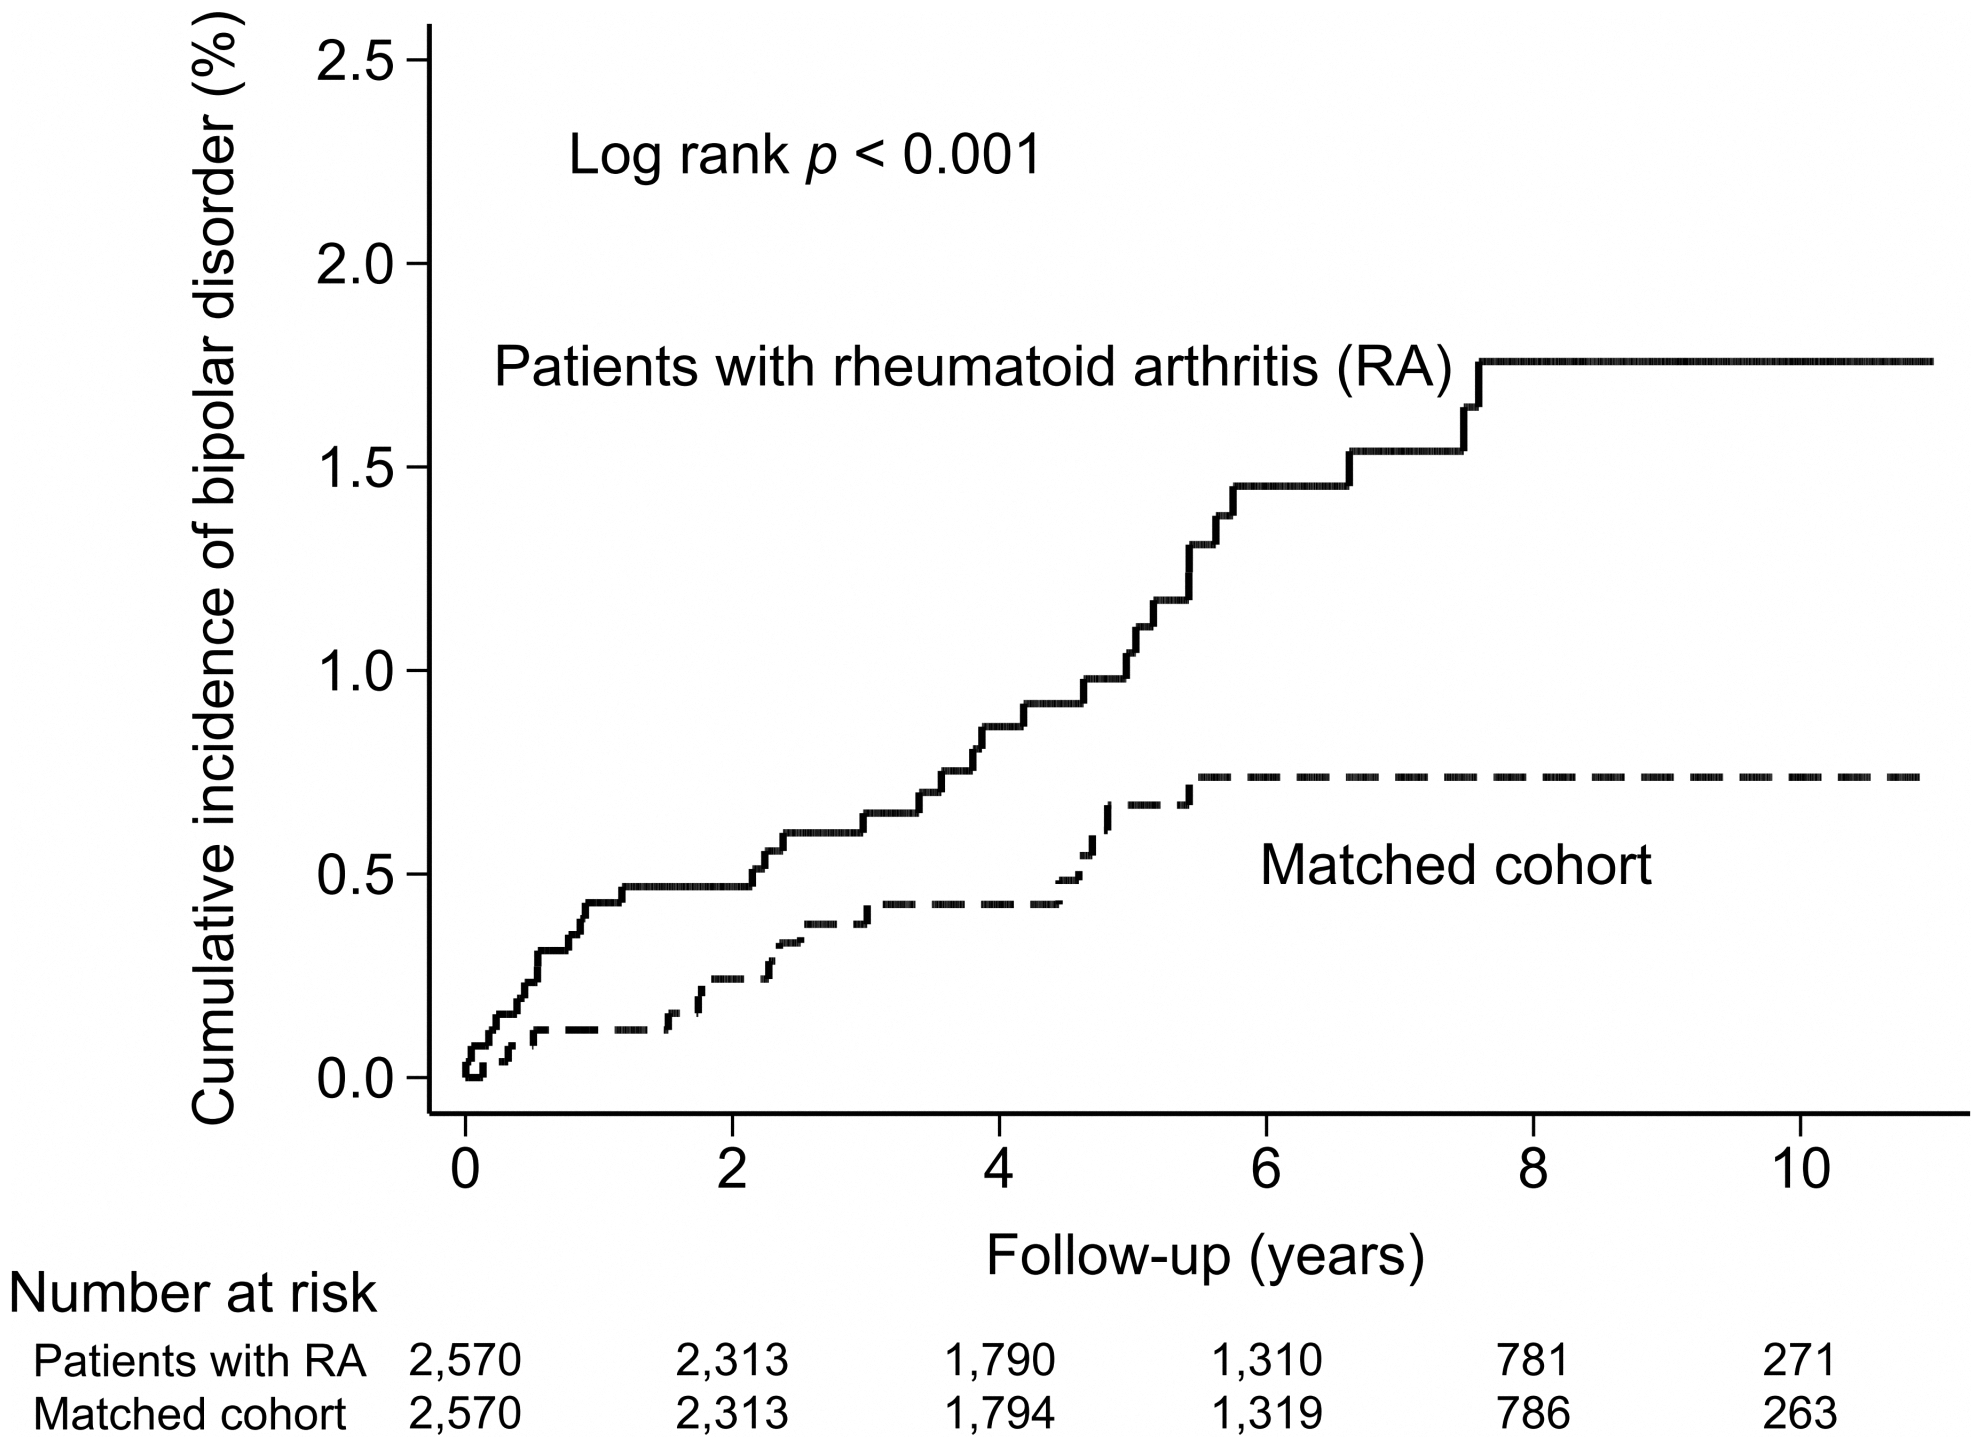
Rheumatoid arthritis and the risk of bipolar disorder: a nationwide population-based study
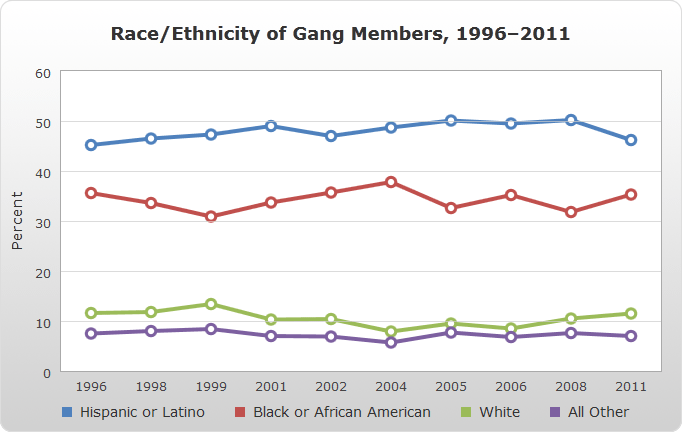
US: Race/Ethnicity of Gang Members
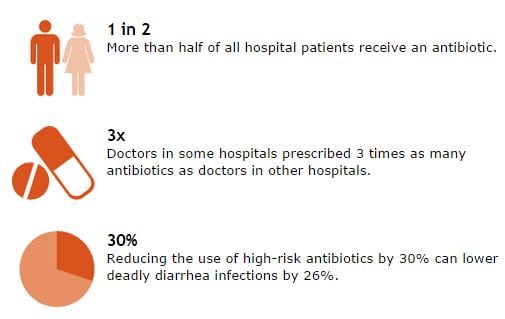
Antibiotic Rx in Hospitals: Proceed with Caution

Thumbnail
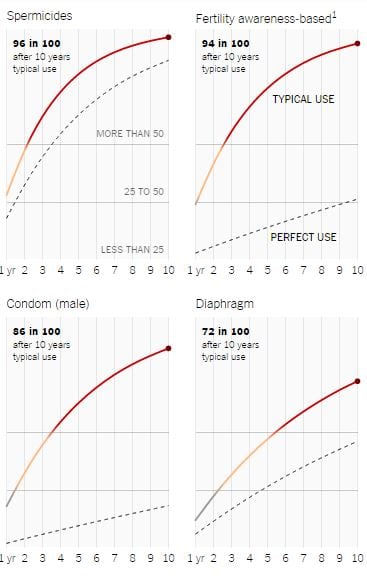
How Likely Is It That Birth Control Could Let You Down? (click here for expanded interactive version)
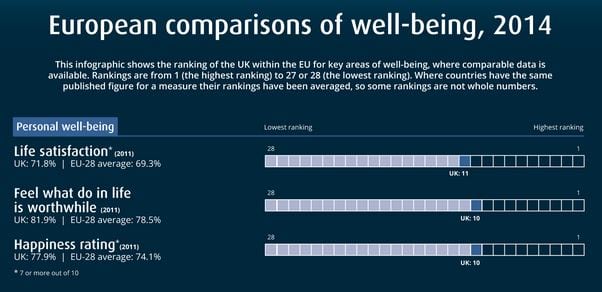
European comparisons of well-being, 2014 (click here for complete infographic)
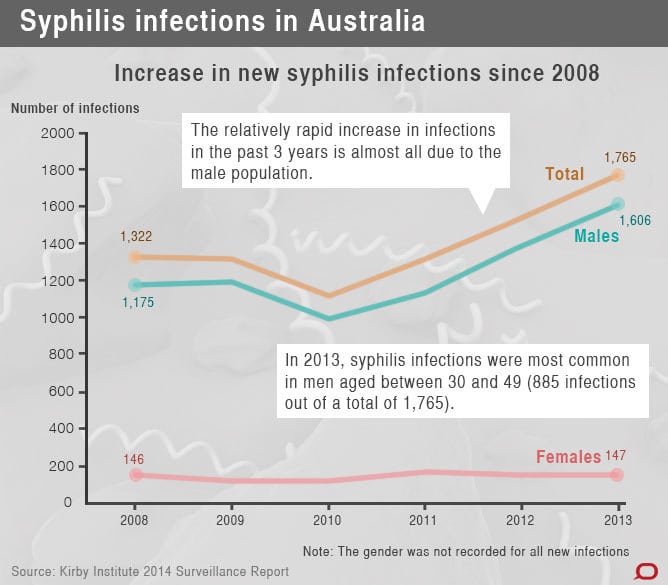
Declining condom use driving sexually-transmitted infections
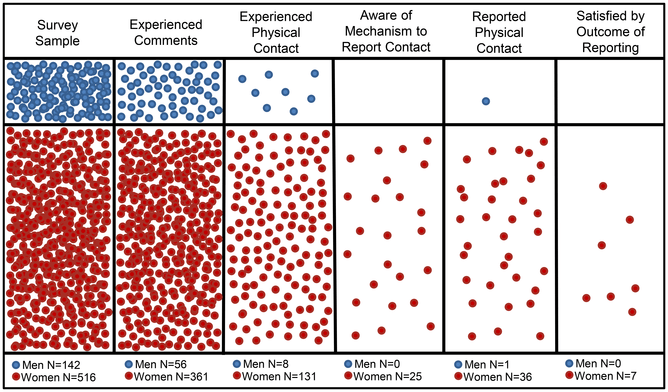
We need to talk about the sexual abuse of scientists
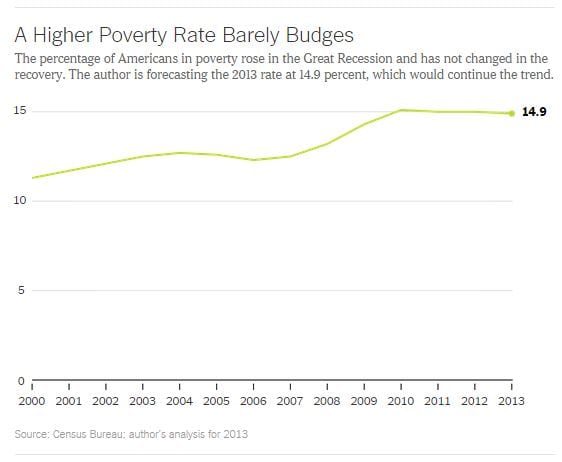
What the Poverty Rate Tells Us About the Overall Economy
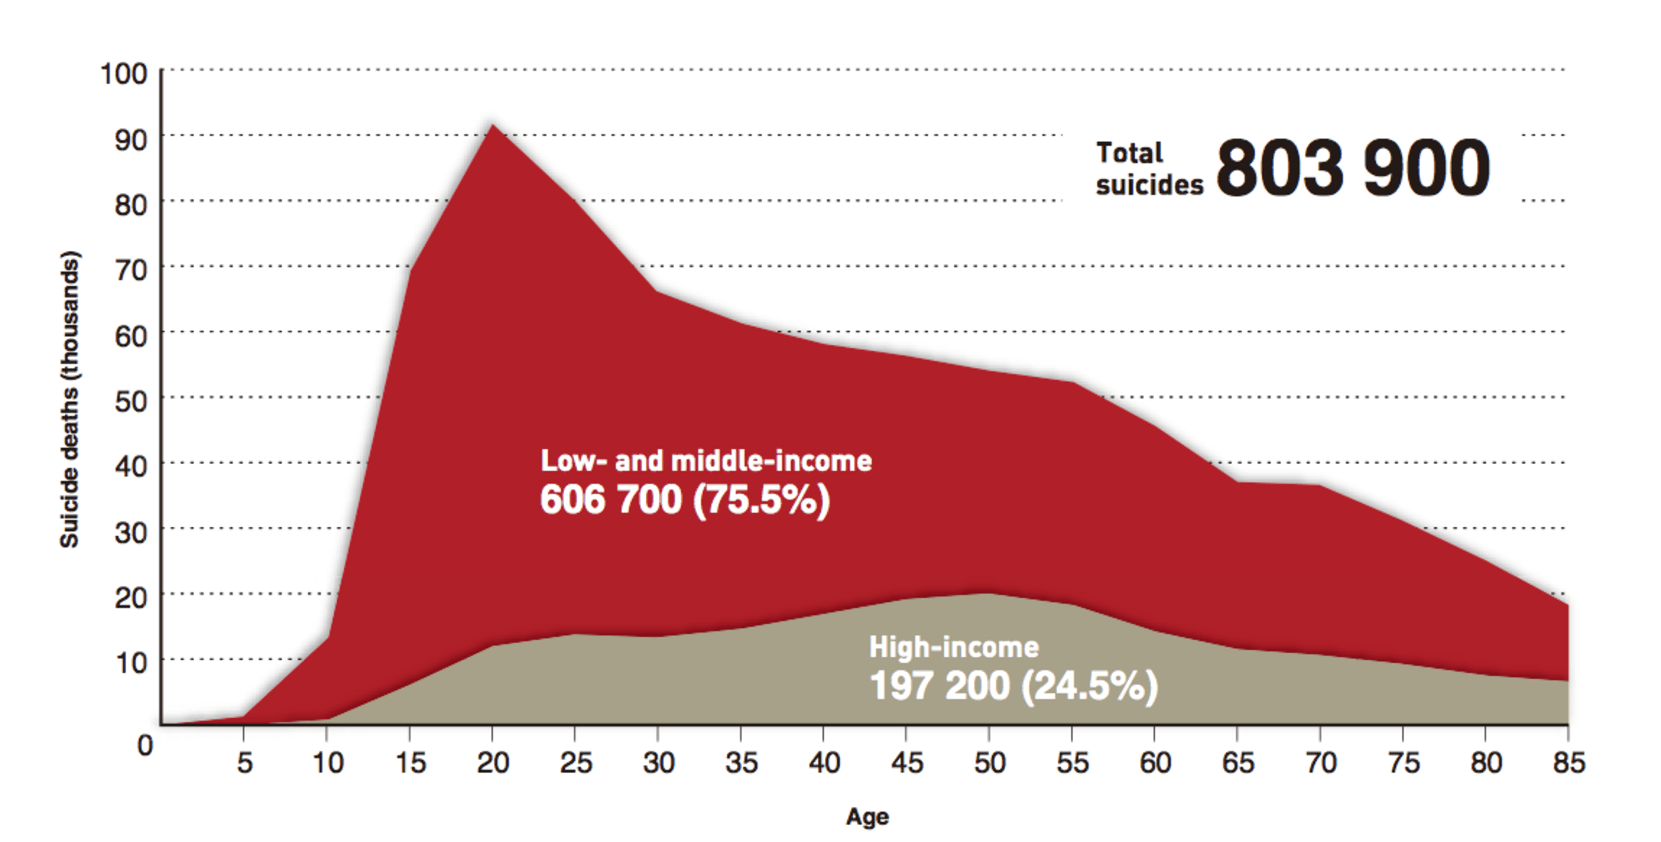
WHO report maps global suicide problem for the first time
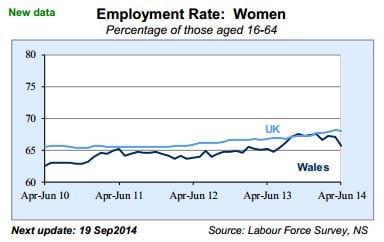
Key Welsh Economic Statistics – August 2014
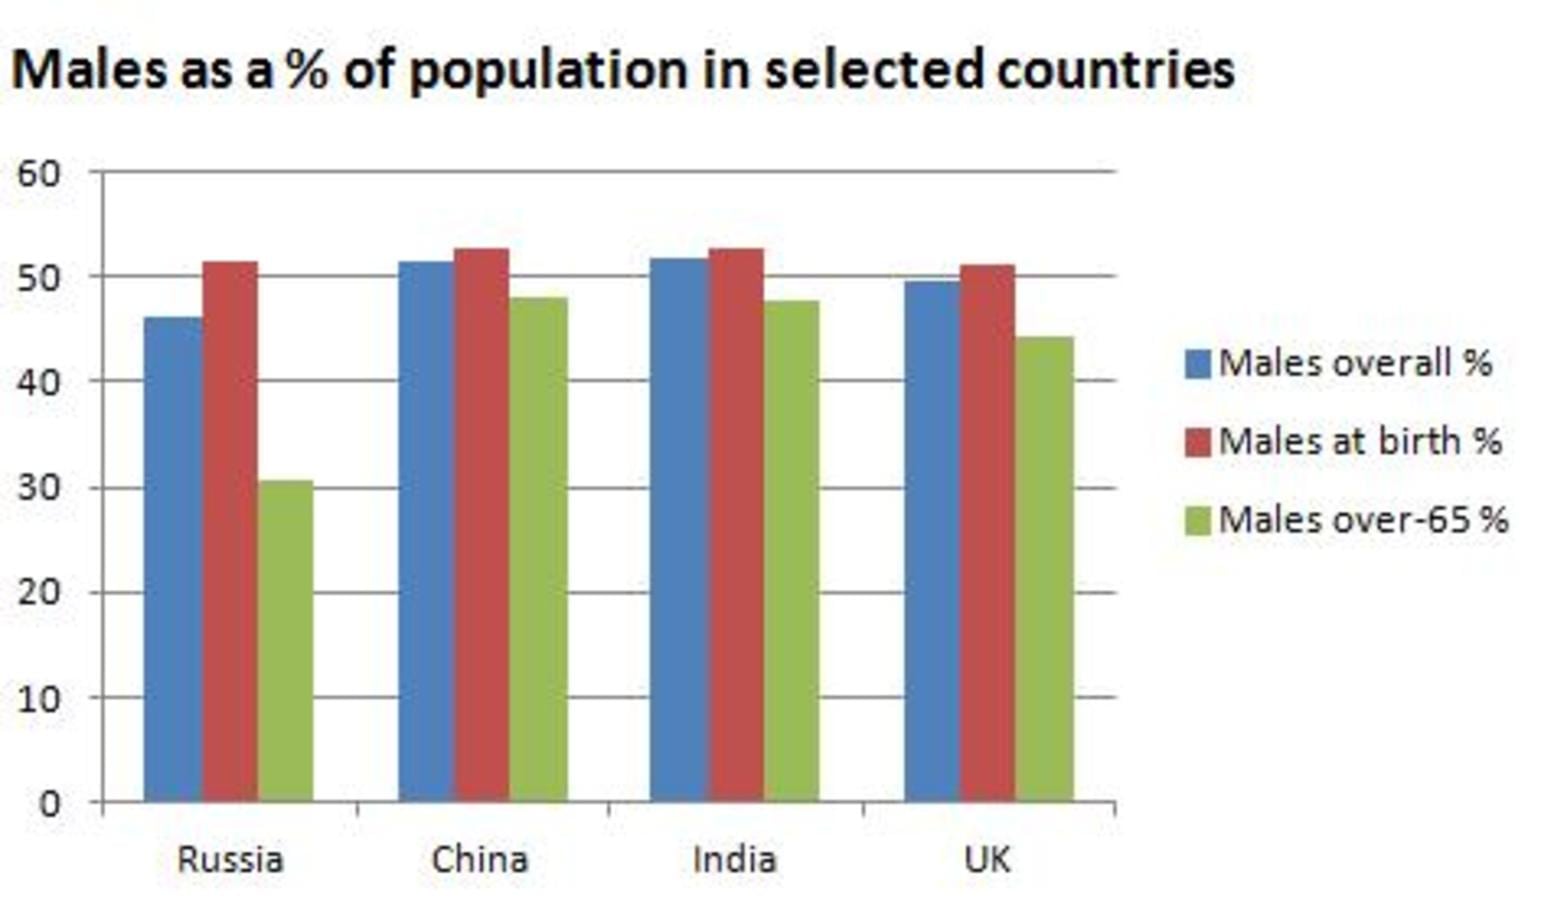
What you can tell about a country’s future by looking at its gender balance
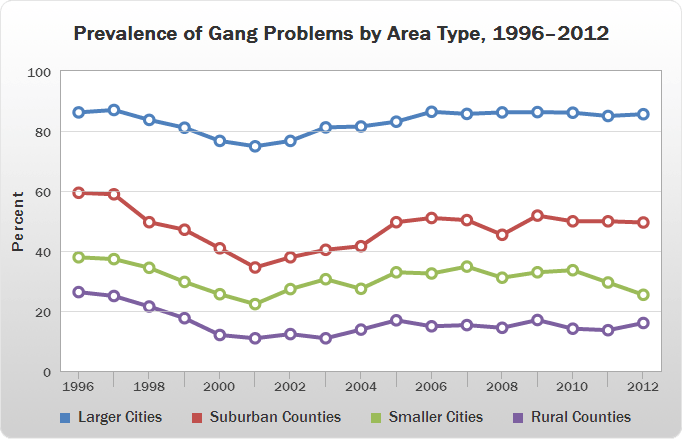
US: Prevalence of Gang Problems by Area Type
HIV & mental health
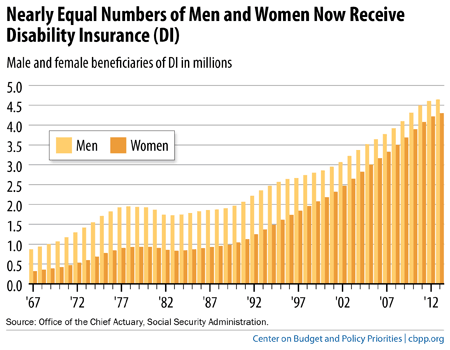
Women DI recipients have caught up with men
Destination of Leavers from UK Higher Education Institutions: Northern Ireland

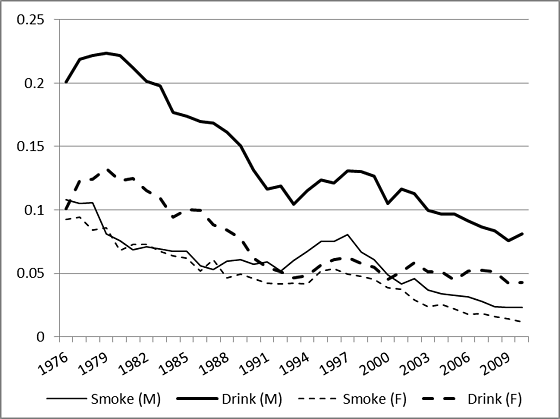
Changing Patterns of Tobacco and Alcohol Co-Use by Gender in the United States, 1976-2010
Death Rates from Unintentional Drowning, by Age Group and Sex — United States, 2011
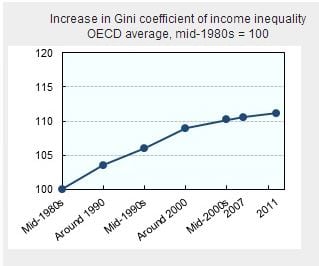
OECD Income Distribution Database: Gini, poverty, income, Methods and Concepts
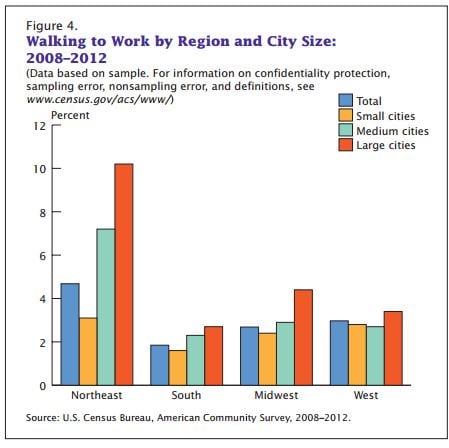
Walking to Work
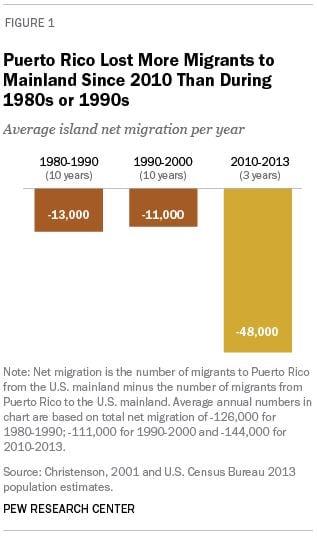
Puerto Ricans Leaving Island for Mainland
Disability can have devastating economic consequences

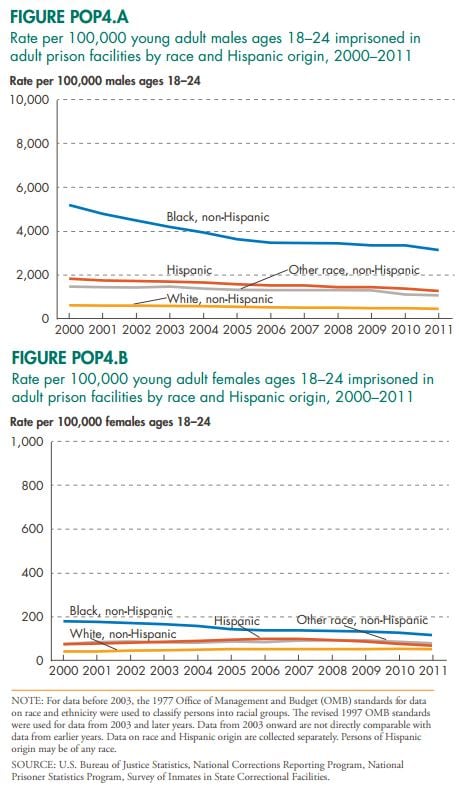
Young adult imprisonment rates
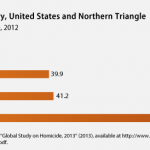
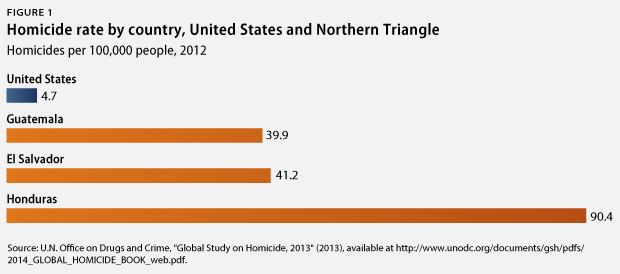
Violence Is Causing Children to Flee Central America
Thumbnail
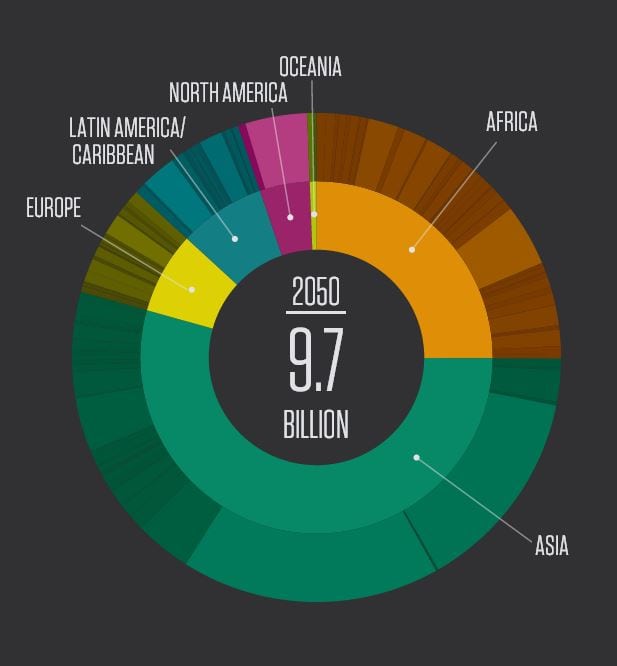
World Population
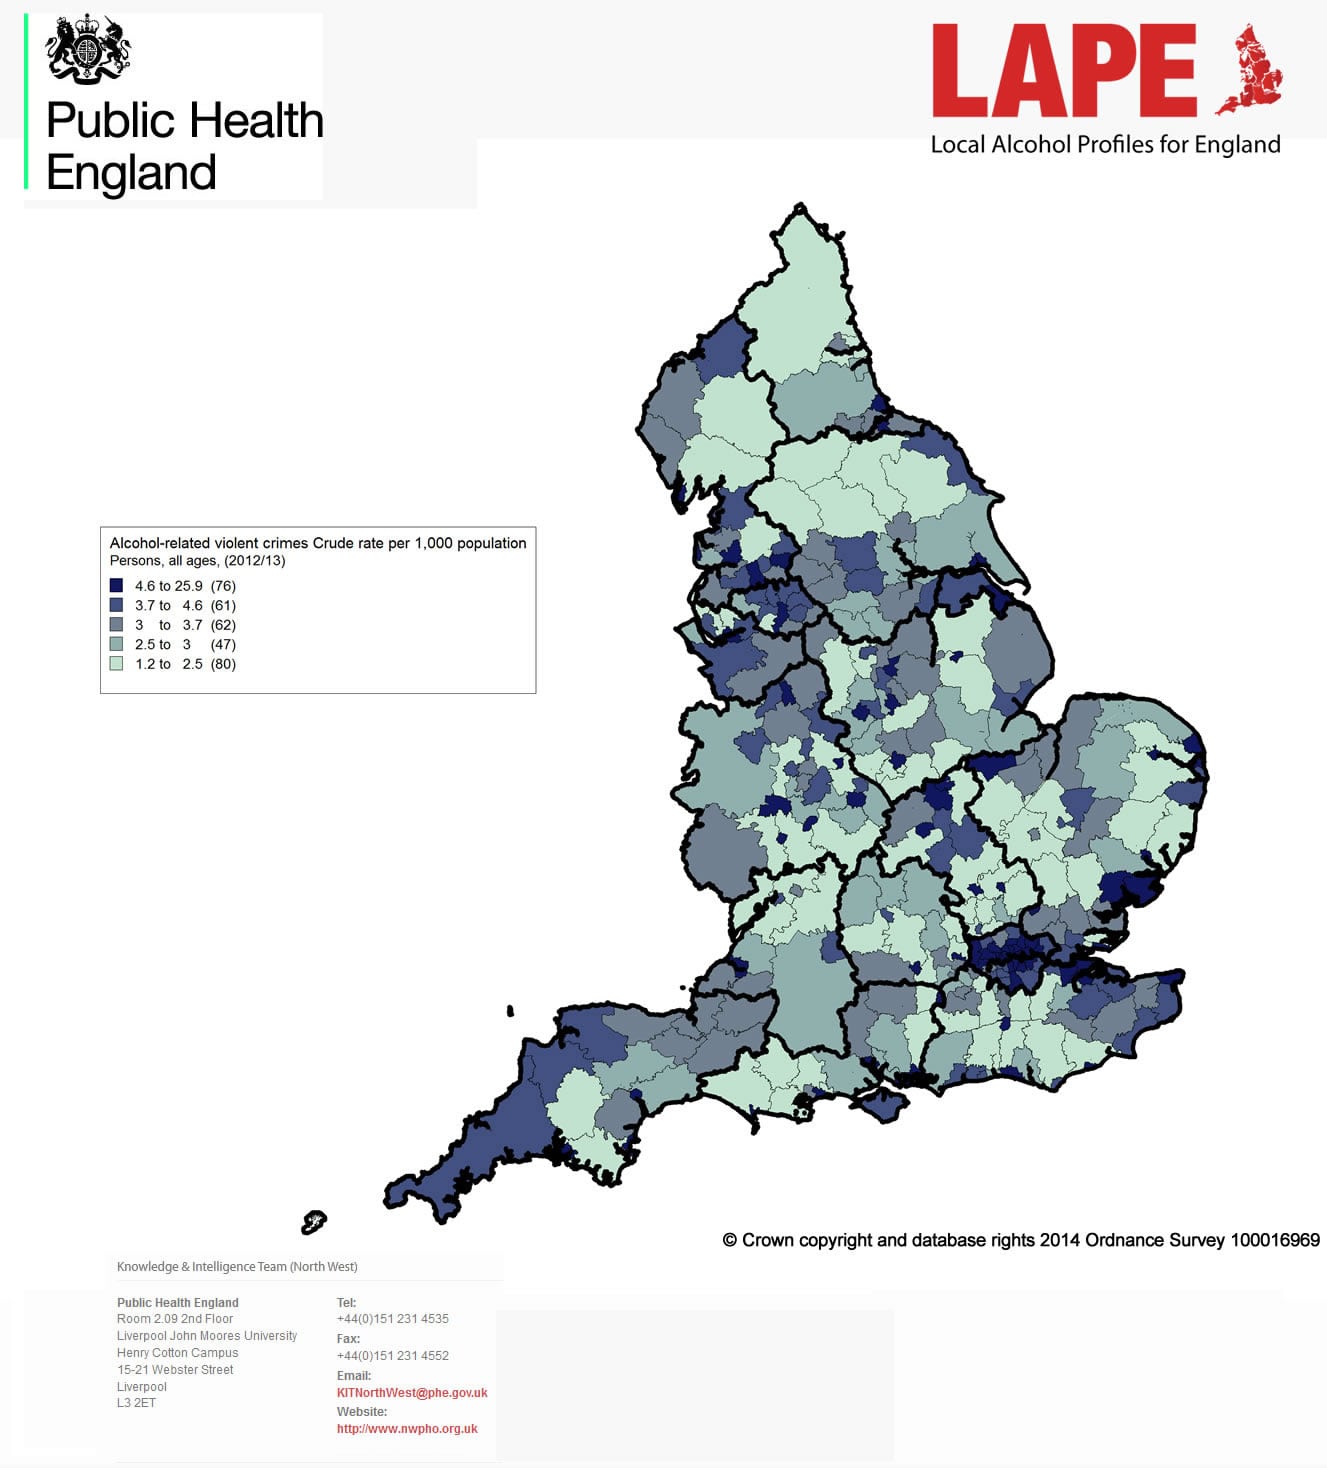
Local alcohol profiles for England – Alcohol related violent crime
The most (and least) profitable professions in Massachusetts
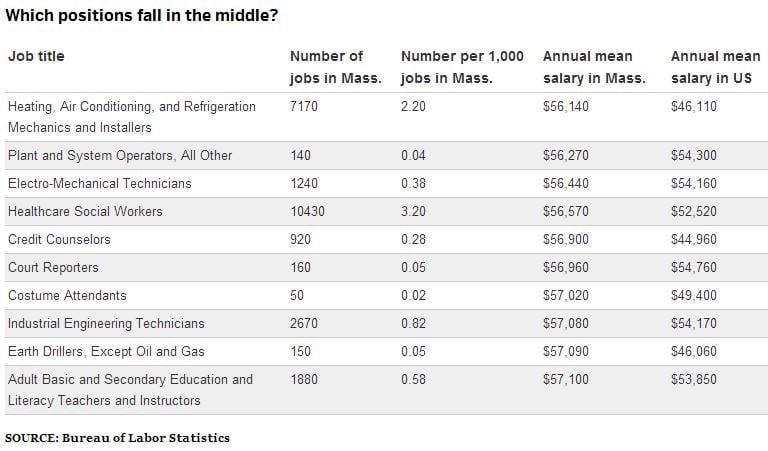 Boston Globe | BLS
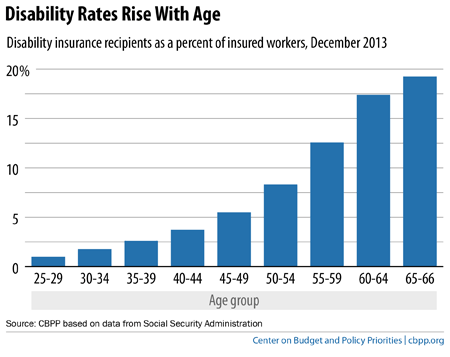
The risk of disability rises with age
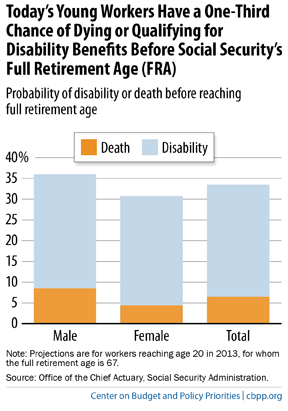
Why Is Social Security Disability Insurance Important?
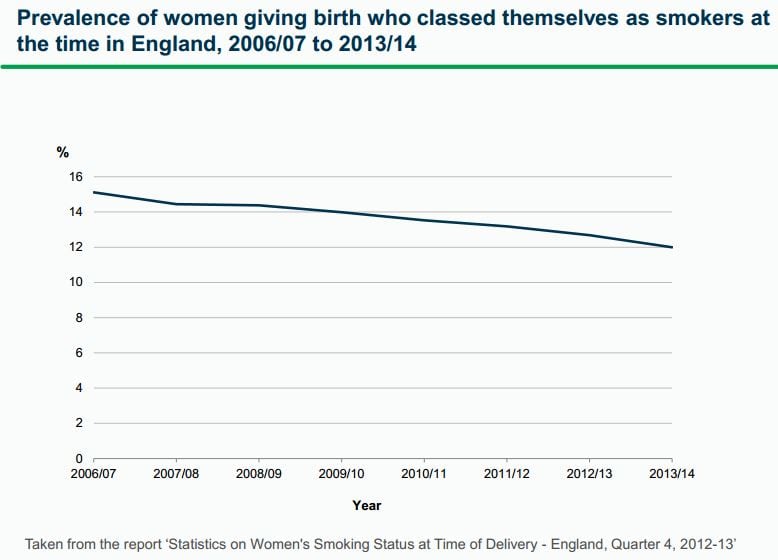
Prevalence of mothers smoking whilst pregnant is lowest on record
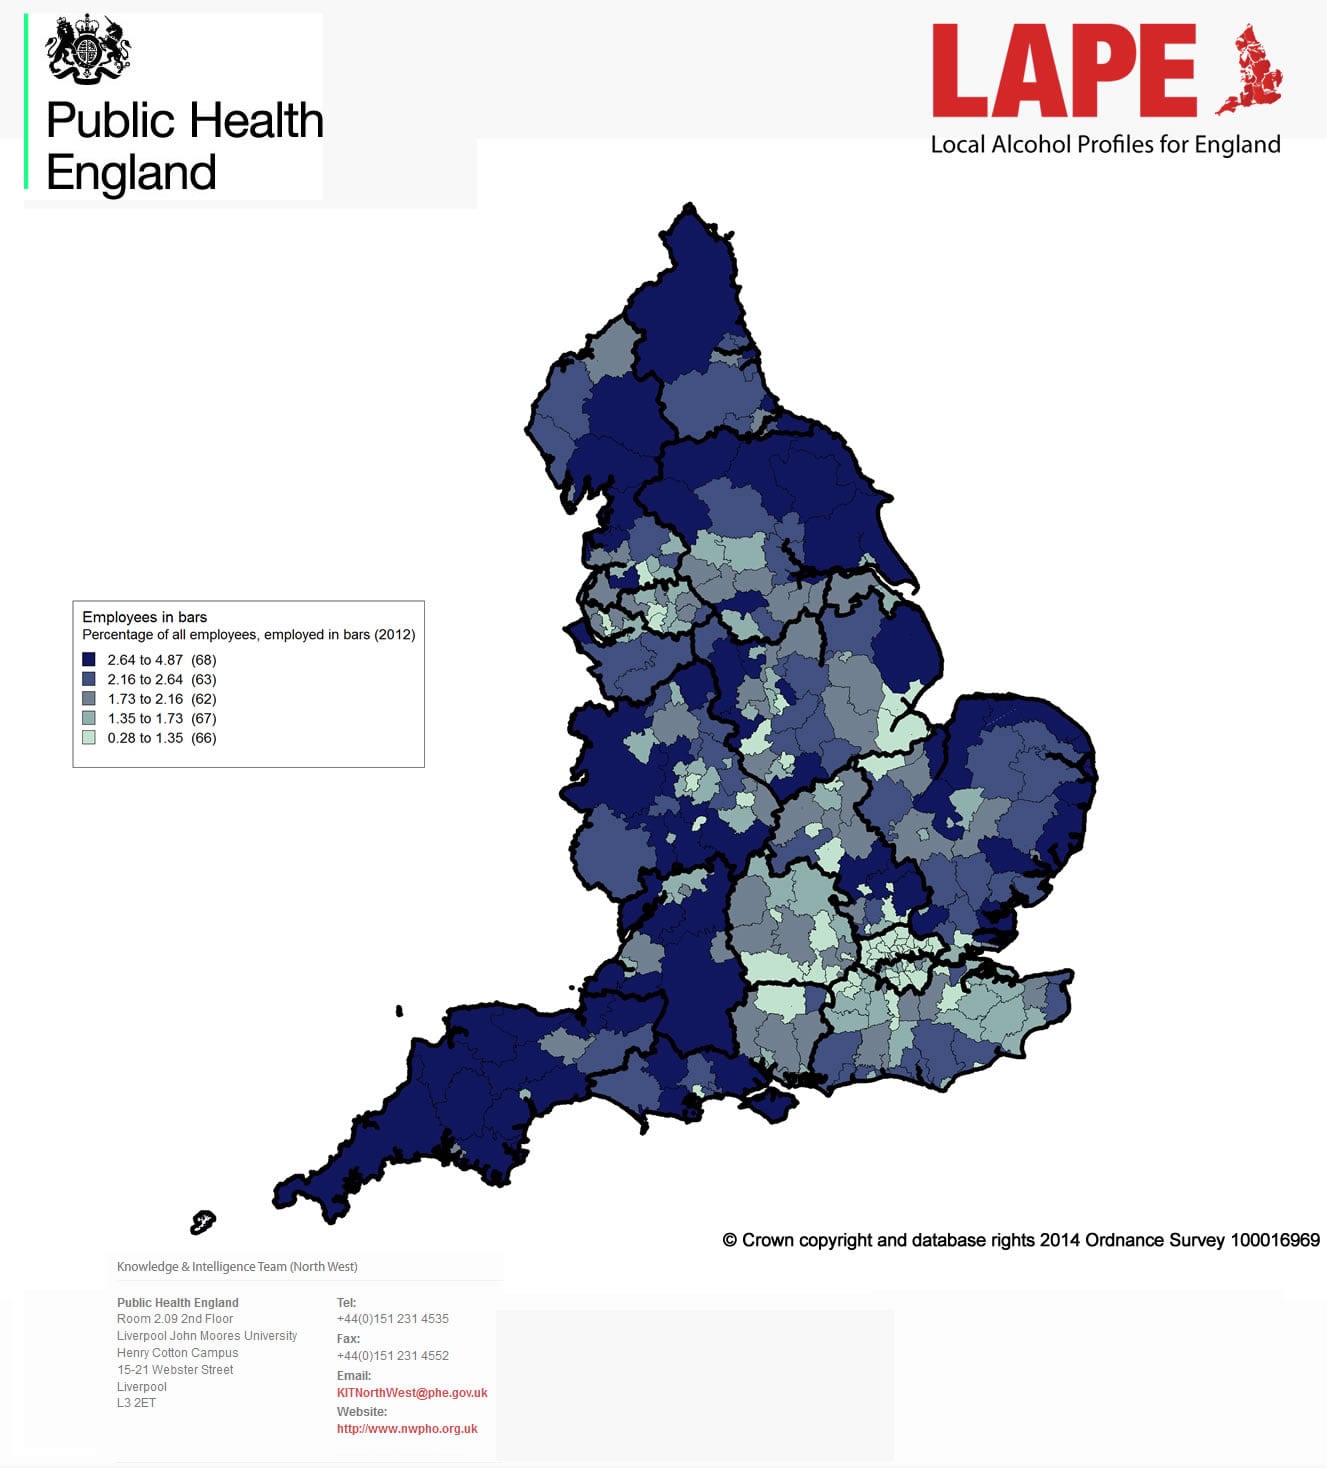
Local alcohol profiles for England – Employees in bars
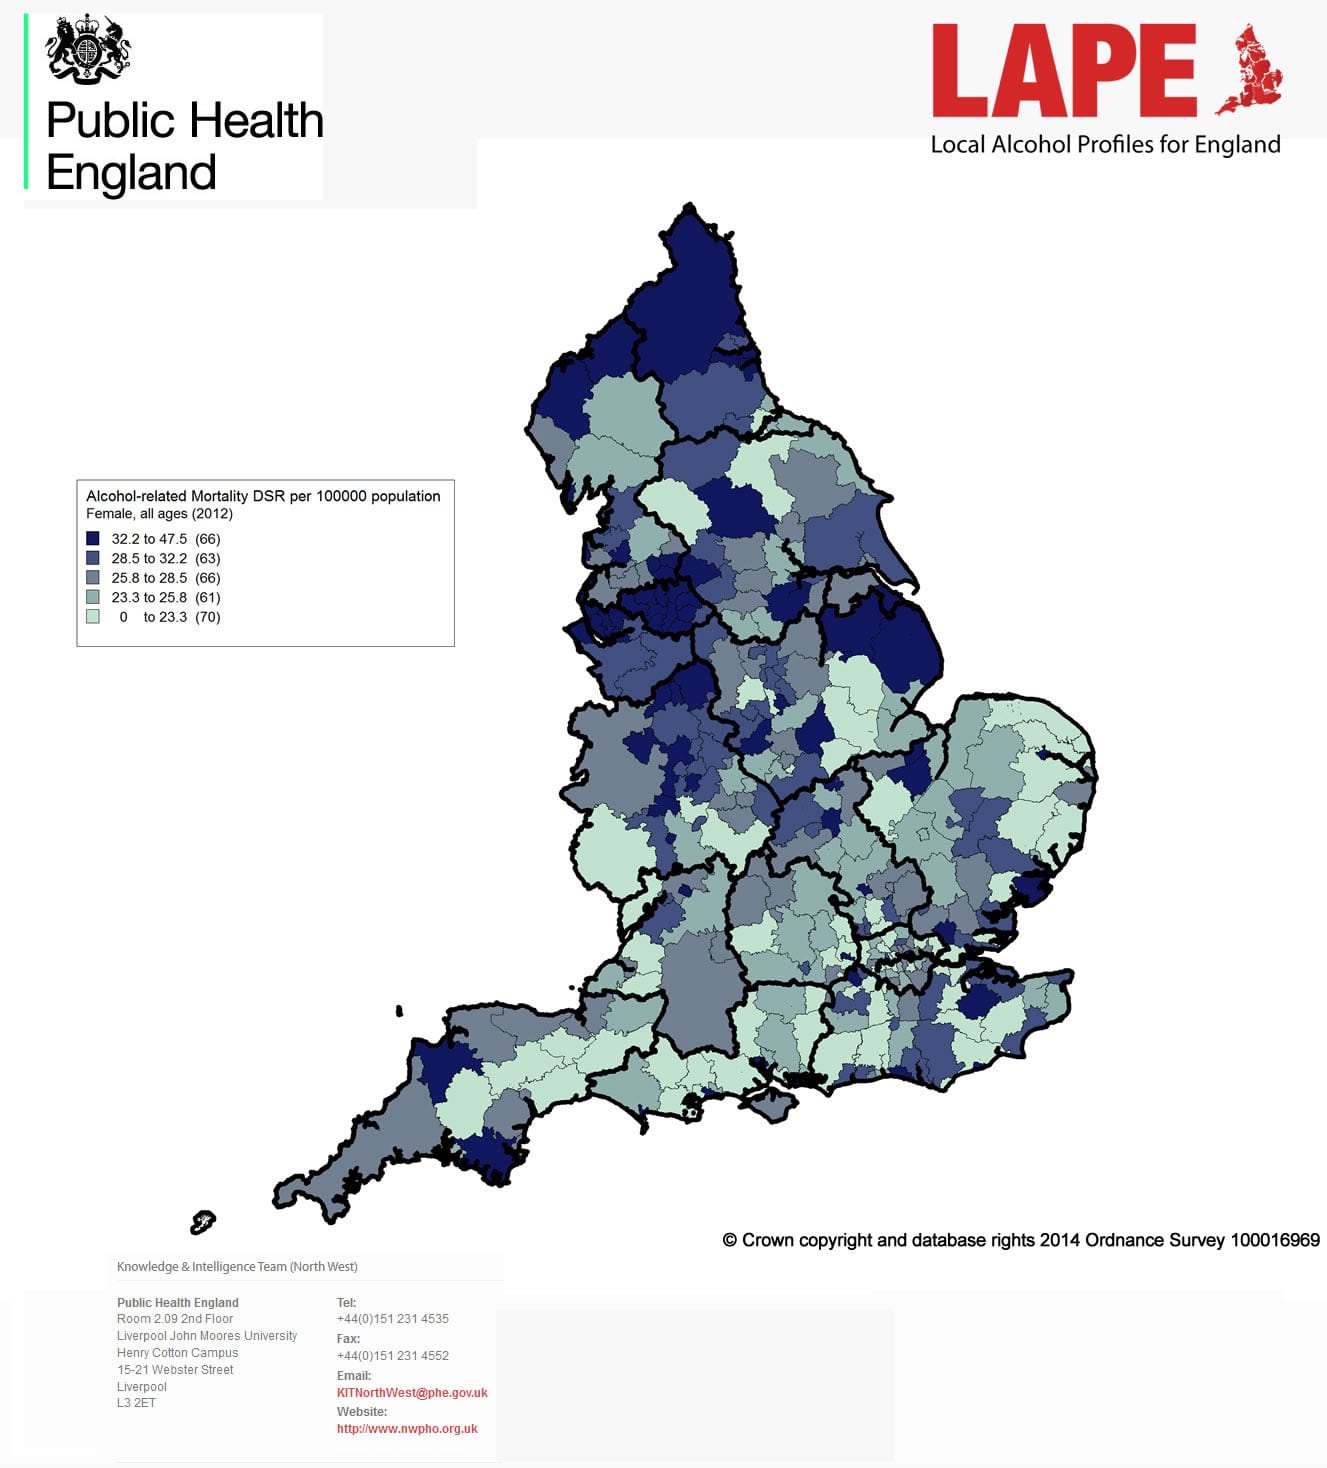
Local alcohol profiles for England – Alcohol-related mortality (Female)
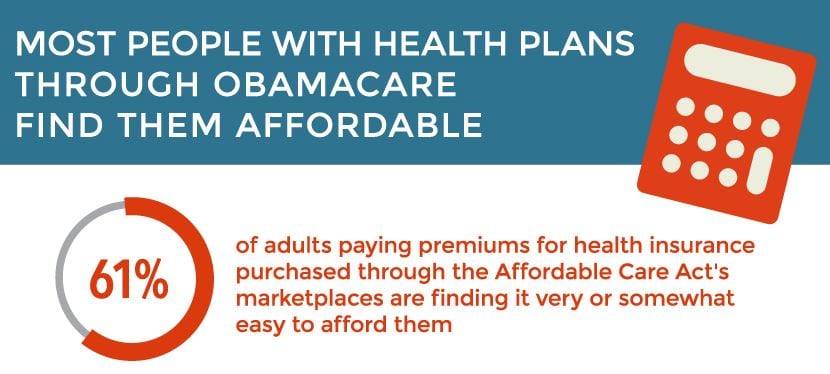
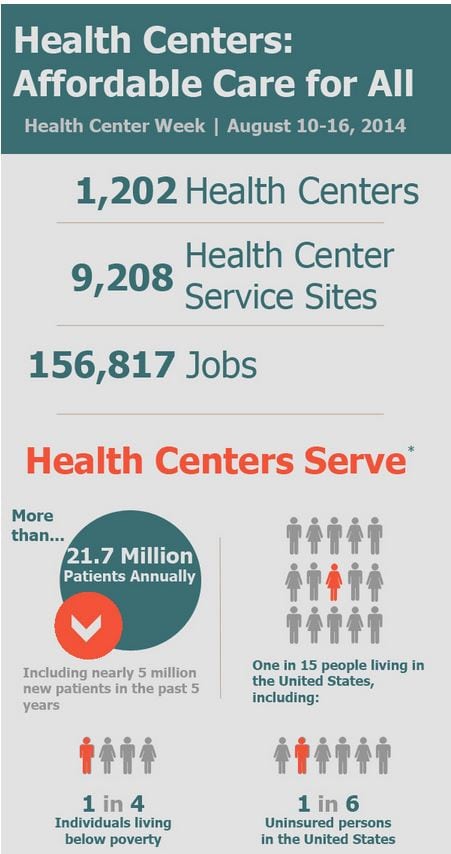
Increasing Access to Affordable, Cost Effective, High Quality Care
Human Papillomavirus Vaccination Coverage Among Adolescents, 2007–2013, and Postlicensure Vaccine Safety Monitoring, 2006–2014 — United States
Rate of Nonfatal Fall Injuries Receiving Medical Attention,* by Age Group — National Health Interview Survey,† United States, 2012
England & Wales: Trends in the rate of workplace violence for physical assault and threats 2002-03 to 2012-13 (CSEW)
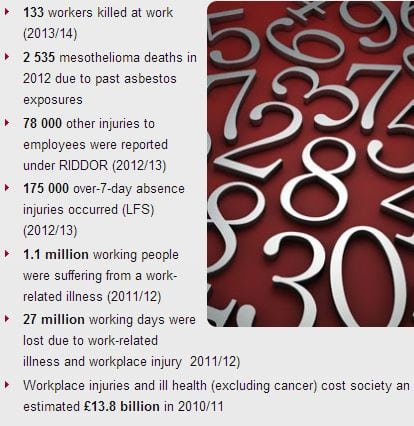
UK – HSE Health Statistics
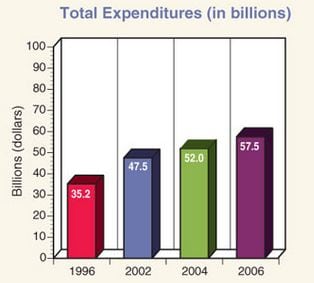
Mental Healthcare Costs for All Americans (1996-2006)
Asian and Pacific Islander children

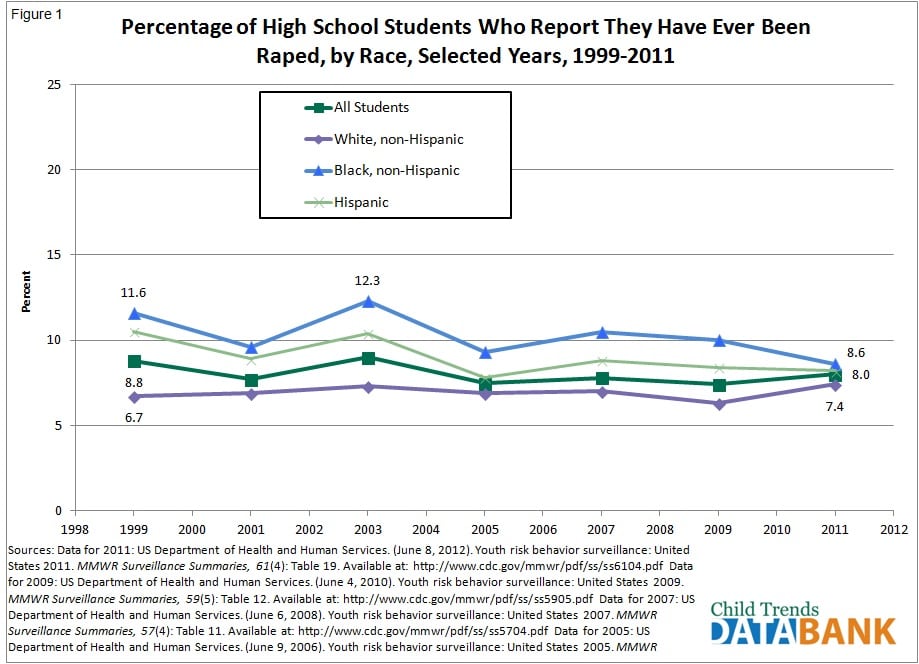
Rape
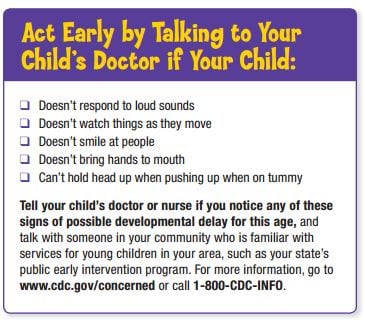
Your baby at 2 months
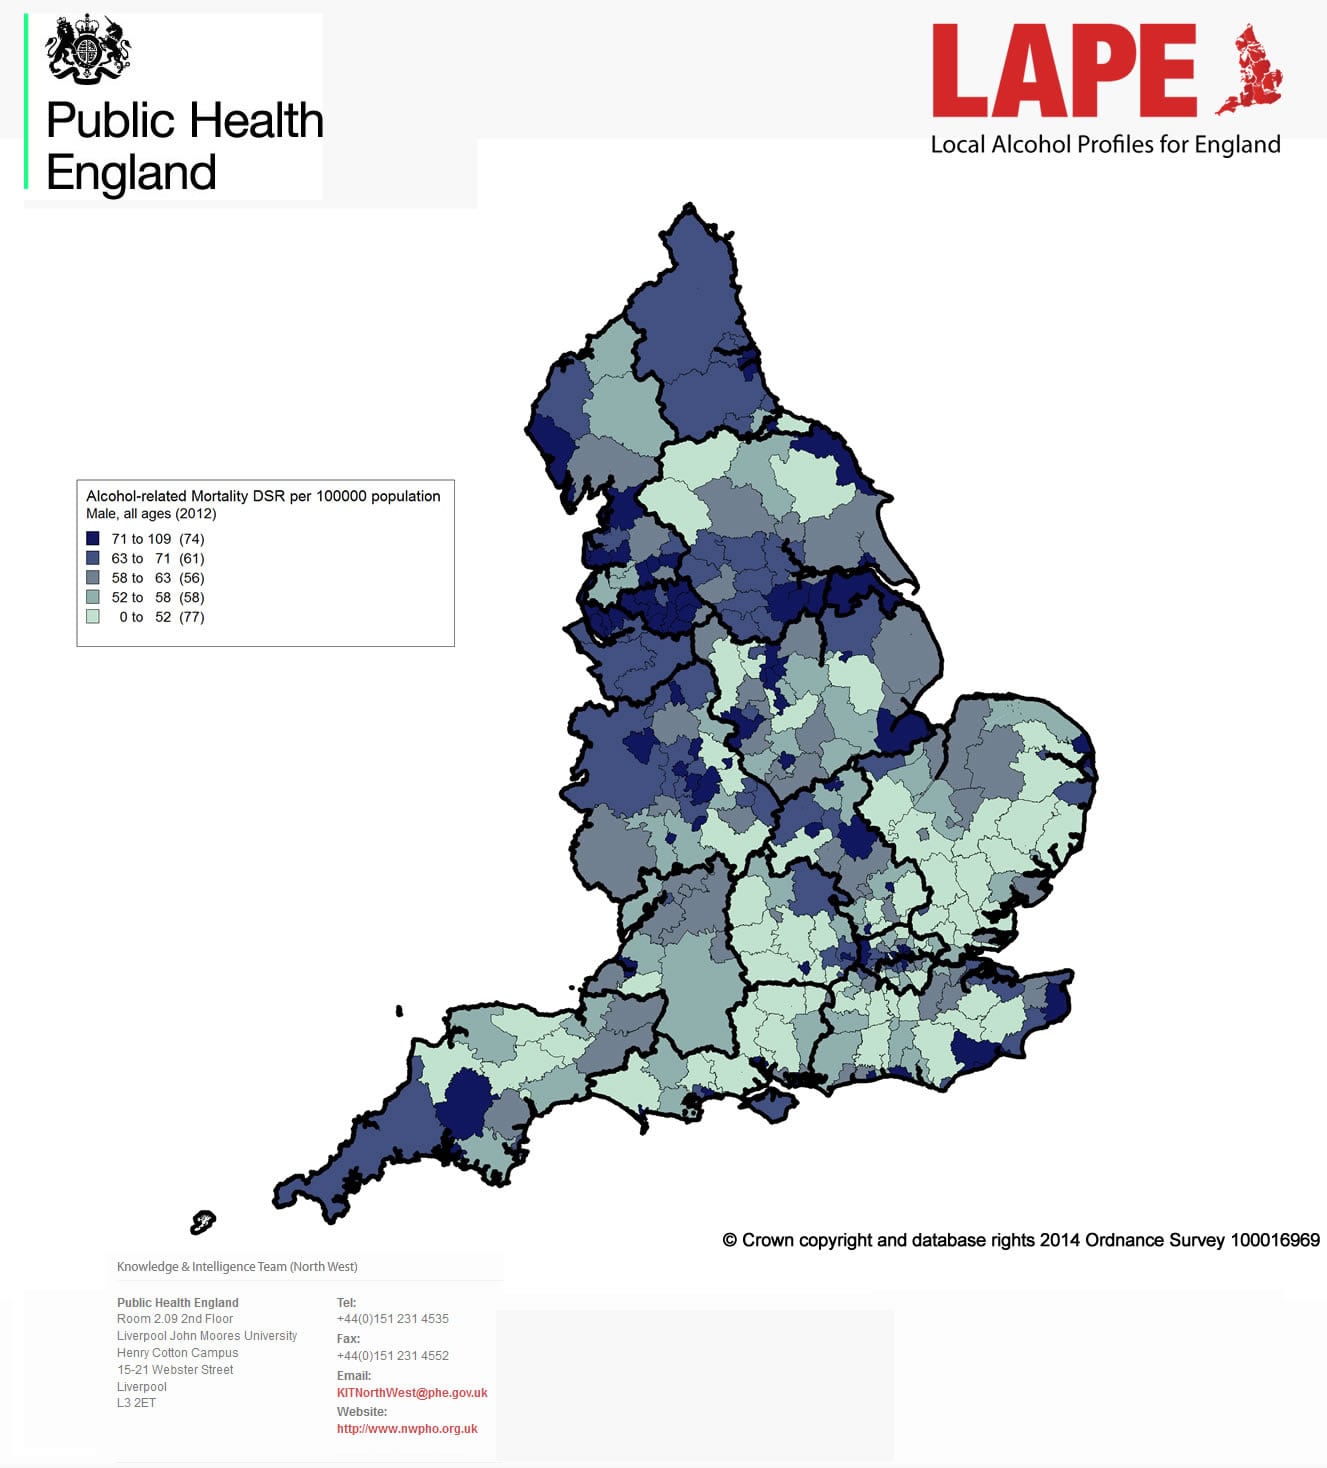
Local alcohol profiles for England – Alcohol-related mortality (Male)
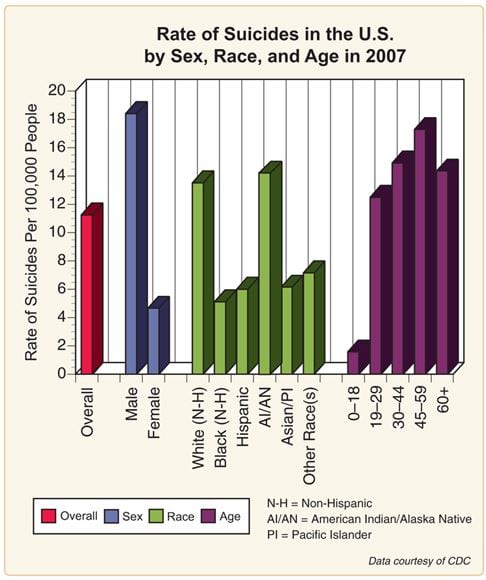
U. S. Suicide Rates 2007