• Skip to primary navigation
  • Skip to main content
  • Skip to primary sidebar

information for practice

news, new scholarship & more from around the world


advanced search
  • gary.holden@nyu.edu
  • @ Info4Practice
  • Archive
  • About
  • Help
  • Browse Key Journals
  • RSS Feeds

Infographics (4,766 posts)

Canadian views

CA-CN-PF

Posted in: Infographics on 10/28/2015 | Link to this post on IFP |
Share

Percentage* of Children Aged 5–17 Years with Diagnosed Attention Deficit/Hyperactivity Disorder (ADHD),† by Poverty Status§ and Sex — National Health Interview Survey,¶ 2011–2014

m6440qsf

Posted in: Infographics on 10/26/2015 | Link to this post on IFP |
Share

How States Use Federal and State Funds Under the TANF Block Grant

tanf14000

Posted in: Infographics on 10/24/2015 | Link to this post on IFP |
Share

Death Rates* for Teens Aged 15–19 Years, by Sex — National Vital Statistics System, United States, 1999–2013

m6439qsf

Posted in: Infographics on 10/22/2015 | Link to this post on IFP |
Share

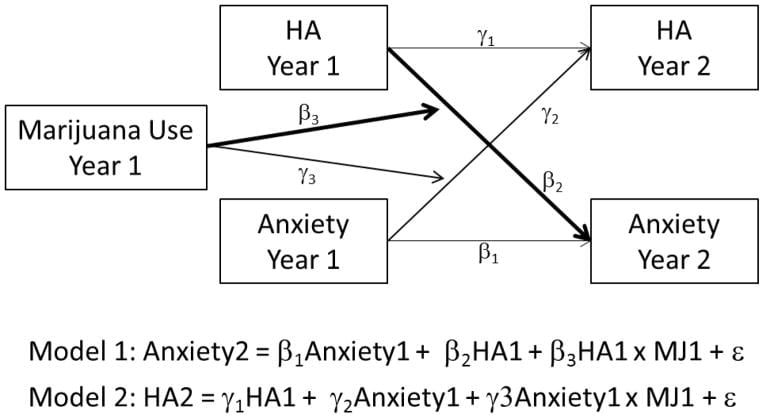
Can marijuana make it better? Prospective effects of marijuana and temperament on risk for anxiety and depression.

nihms703201f1

Posted in: Infographics on 10/21/2015 | Link to this post on IFP |
Share

Global obesity rise puts UN goals on diet-related diseases ‘beyond reach’

whofggooo

Posted in: Infographics on 10/20/2015 | Link to this post on IFP |
Share

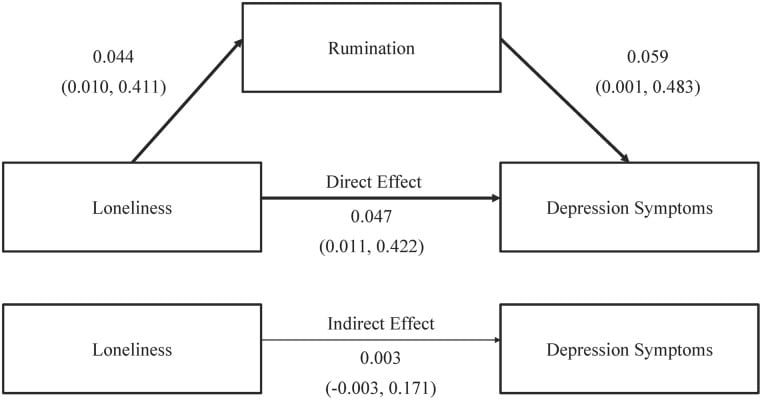
Rumination and Loneliness Independently Predict Six-Month Later Depression Symptoms among Chinese Elderly in Nursing Homes

pone.0137176.g001

Posted in: Infographics on 10/19/2015 | Link to this post on IFP |
Share

Maternal depression and attachment: the evaluation of mother–child interactions during feeding practice

fpsyg-06-01235-g001

Posted in: Infographics on 10/17/2015 | Link to this post on IFP |
Share

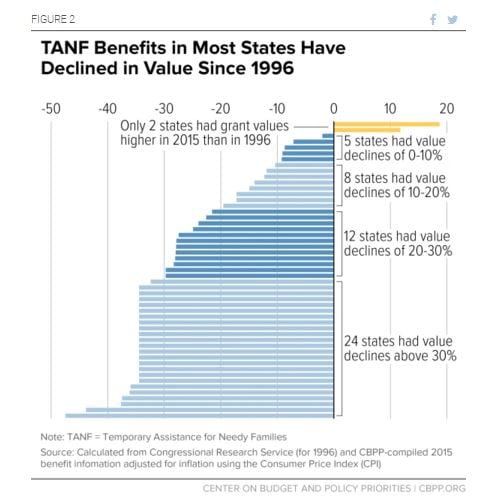
TANF Cash Benefits Have Fallen by More Than 20 Percent in Most States and Continue to Erode

tanf00000

Posted in: Infographics on 10/16/2015 | Link to this post on IFP |
Share

National Latino AIDS Awareness Day

latinoaidsawareness_a400px

Posted in: Infographics on 10/15/2015 | Link to this post on IFP |
Share

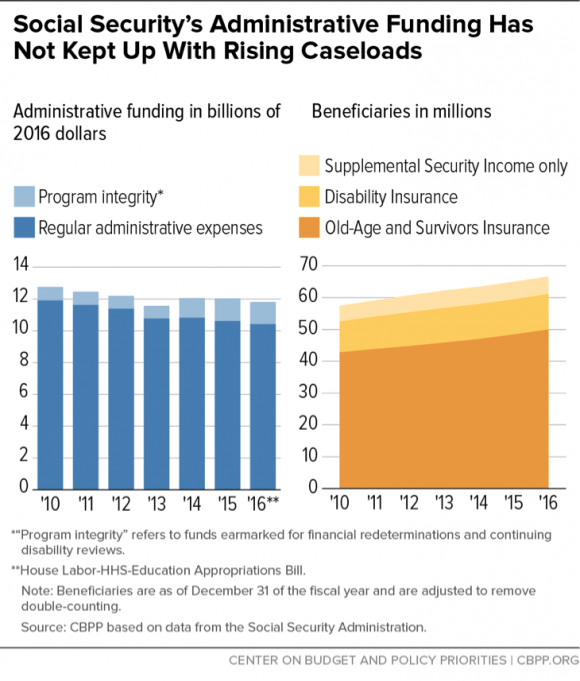
Funding Bills Include Damaging Social Security Service Cuts

social_securitys_administrative_funding

Posted in: Infographics on 10/14/2015 | Link to this post on IFP |
Share

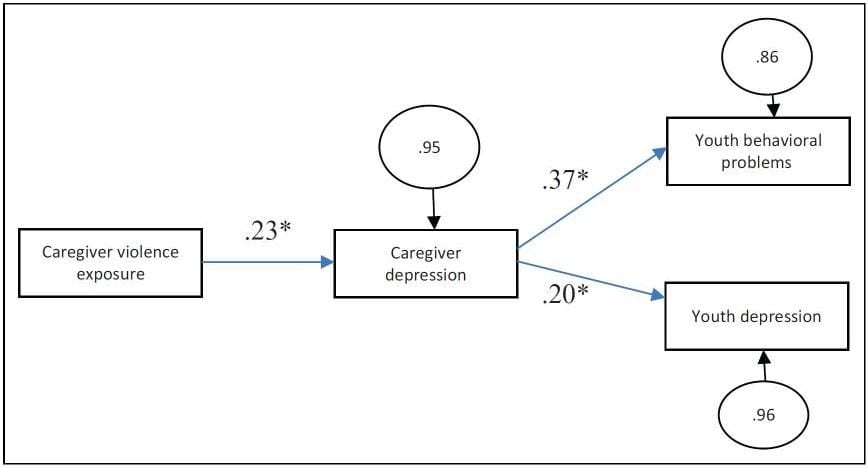
Relationships Between Caregiver Violence Exposure, Caregiver Depression, and Youth Behavioral Health Among Homeless Families

depre444445

Posted in: Infographics on 10/13/2015 | Link to this post on IFP |
Share

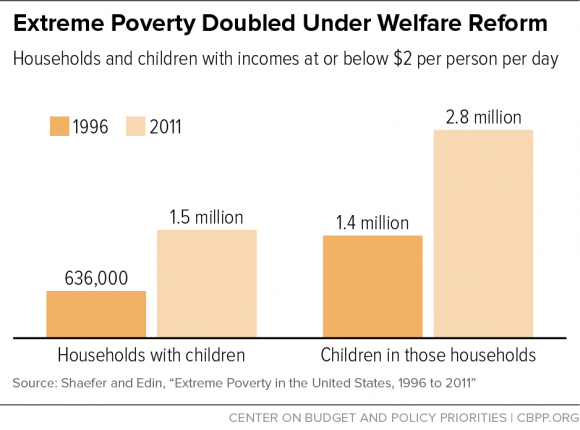
Doubling of Extreme Poverty Belies Welfare Reform Success Claims

extreme_poverty_doubled_under_welfare_reform

Posted in: Infographics on 10/12/2015 | Link to this post on IFP |
Share

Heroin crisis the issue presidential candidates forced to confront on campaign trail

cdcher

Posted in: Infographics on 10/11/2015 | Link to this post on IFP |
Share

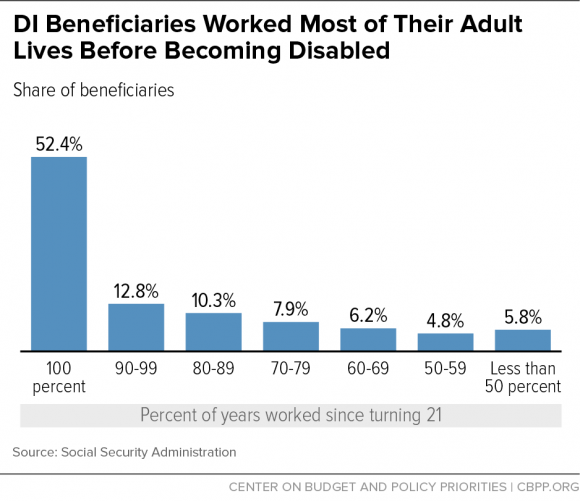
DI Beneficiaries Have Extensive Work Histories
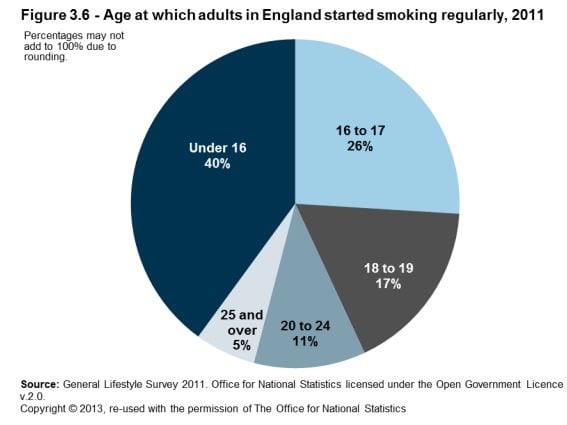
di_beneficiaries_worked_most_of_their_adult_life_before_becoming_disabled

Posted in: Infographics on 10/10/2015 | Link to this post on IFP |
Share

UK: Smoking

smikinguk

Posted in: Infographics on 10/09/2015 | Link to this post on IFP |
Share

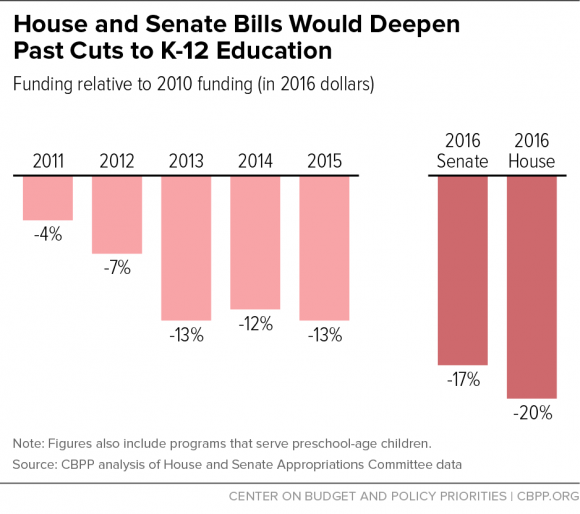
Sequestration Squeezing Federal Support for Schools

house-senate-bills-deepen-education-cuts

Posted in: Infographics on 10/07/2015 | Link to this post on IFP |
Share

Northern Ireland: Compulsory Admissions (Detentions) Under the Mental Health (NI) Order

nideten

Posted in: Infographics on 10/06/2015 | Link to this post on IFP |
Share

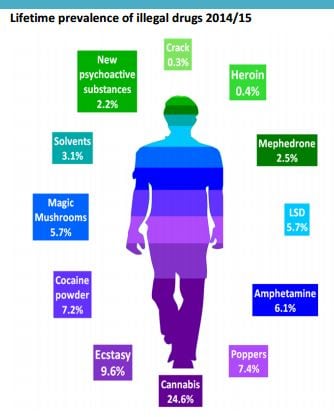
Drug Prevalence in Northern Ireland Key Facts – 2014/15

lpnisubs

Posted in: Infographics on 10/05/2015 | Link to this post on IFP |
Share

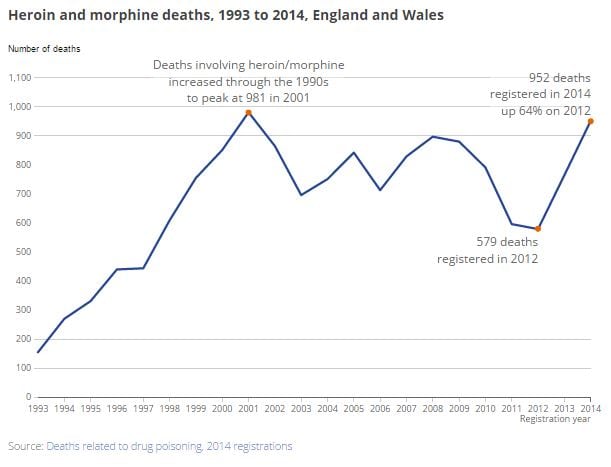
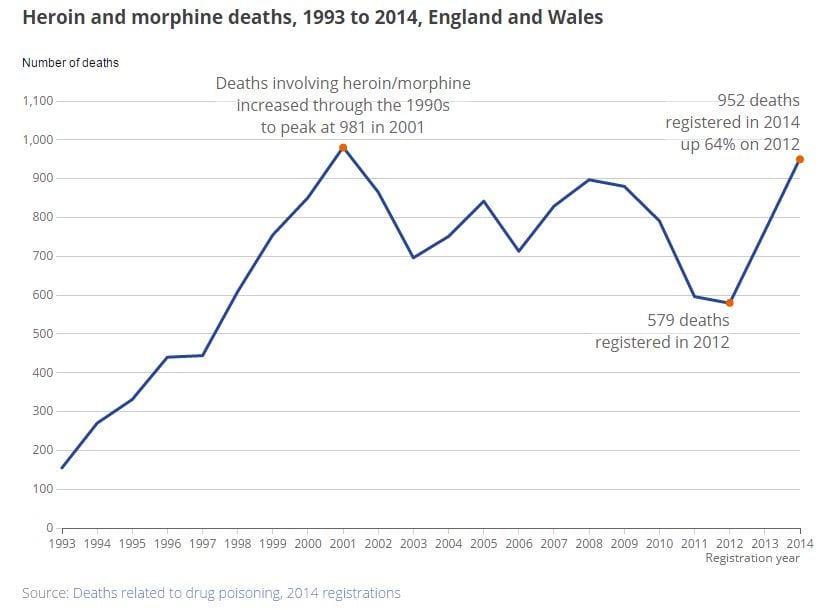
Deaths involving heroin up by two thirds in two years

heroindeaths

Posted in: Infographics on 10/04/2015 | Link to this post on IFP |
Share

Northern Ireland life expectancy over time

nimort

Posted in: Infographics on 10/03/2015 | Link to this post on IFP |
Share

The history of strikes in Britain

lstrikeuk

Posted in: Infographics on 10/02/2015 | Link to this post on IFP |
Share

QuickStats: Percentage of Children and Adolescents Aged 5–17 Years with Diagnosed Attention-Deficit/Hyperactivity Disorder (ADHD),* by Race and Hispanic Ethnicity — National Health Interview Survey,† United States, 1997–2014

m6433qsf

Posted in: Infographics on 10/01/2015 | Link to this post on IFP |
Share

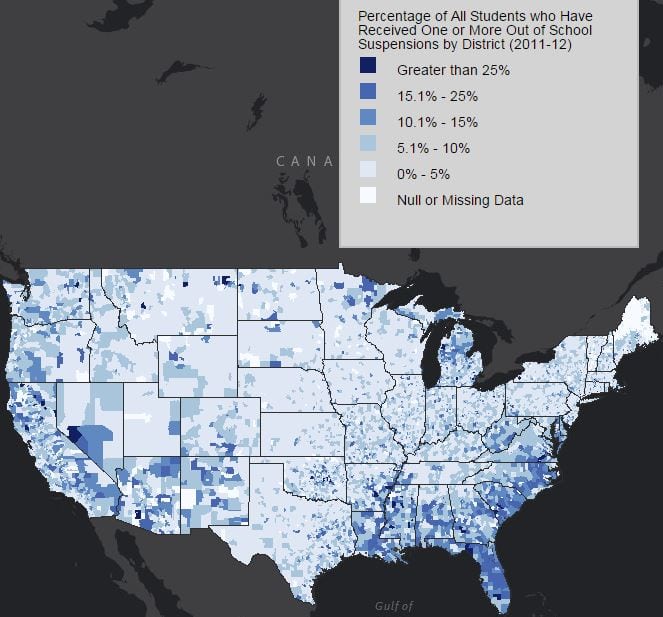
The Hidden Cost of Suspension: How can kids learn if they’re not in school? (interactive – click here)

ssusp2

Posted in: Infographics on 09/30/2015 | Link to this post on IFP |
Share

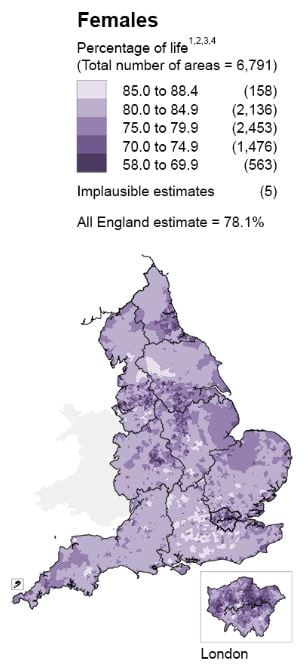
Map 1: Proportion of life spent in ‘Good’ health at birth by sex, by MSOAs, England, 2009 to 2013

ukle88

Posted in: Infographics on 09/29/2015 | Link to this post on IFP |
Share

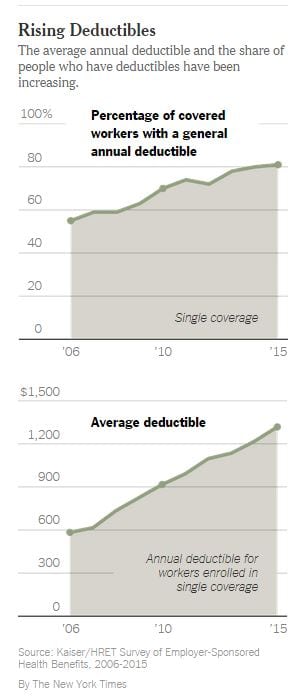
Health Insurance Deductibles Outpacing Wage Increases, Study Finds

nytded

Posted in: Infographics on 09/28/2015 | Link to this post on IFP |
Share

Postpartum depressive symptoms – 2009-2011 (interactive – click here)

ppd

Posted in: Infographics on 09/27/2015 | Link to this post on IFP |
Share

Kids & cops

cops2

Posted in: Infographics on 09/26/2015 | Link to this post on IFP |
Share

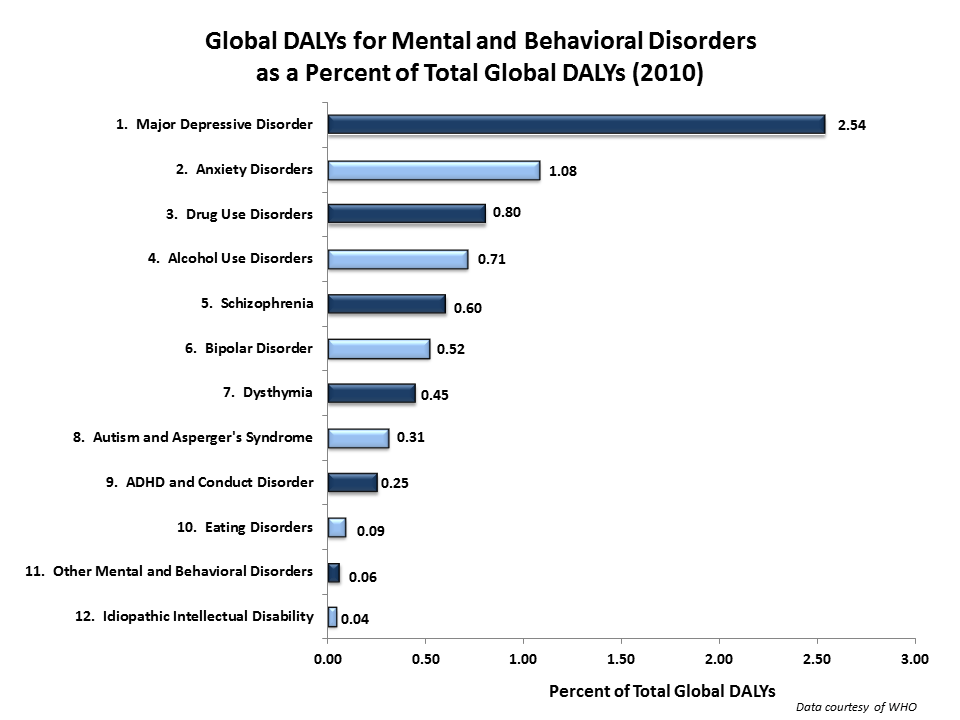
Global DALYs Contributed by Mental and Behavioral Disorders

global_DALYS_disorders_148415_1

Posted in: Infographics on 09/25/2015 | Link to this post on IFP |
Share

Alcohol use among youth – 2013 (interactive – click here)

etohy

Posted in: Infographics on 09/24/2015 | Link to this post on IFP |
Share

Mental Health Statistics

stat-page

Posted in: Infographics on 09/23/2015 | Link to this post on IFP |
Share

Fast Facts about Mental Illness

mhcanada

Posted in: Infographics on 09/22/2015 | Link to this post on IFP |
Share

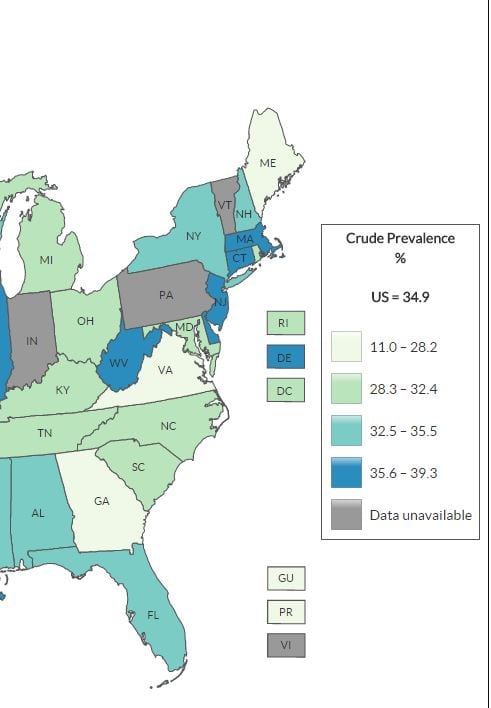
BRFSS: Graph of Current Adult Obesity Prevalence (interactive – click here)

obesbrgsss

Posted in: Infographics on 09/21/2015 | Link to this post on IFP |
Share

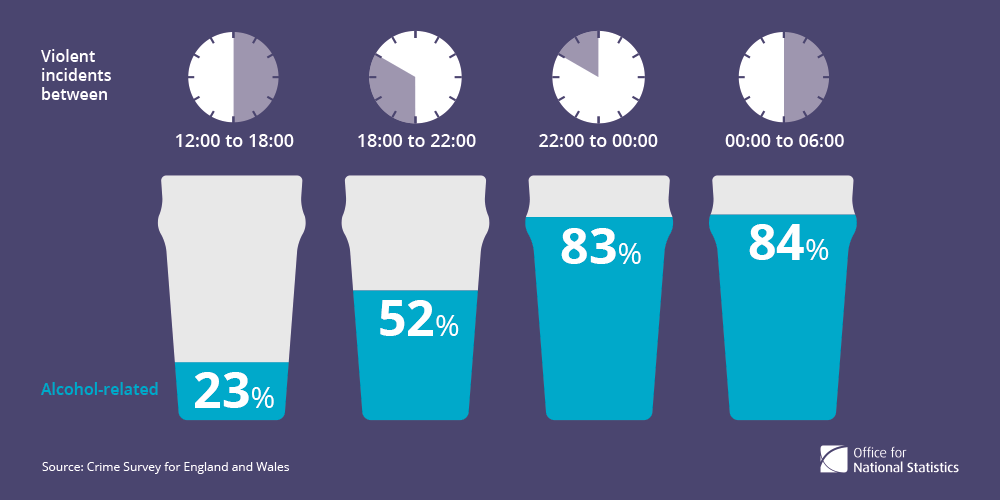
The proportions of violent incidents that were alcohol-related increased as the evening progressed

arvimage5_tcm77-395307

Posted in: Infographics on 09/20/2015 | Link to this post on IFP |
Share

Medicare & Medicaid

50-years-keeping-us-healthy

Posted in: Infographics on 09/19/2015 | Link to this post on IFP |
Share

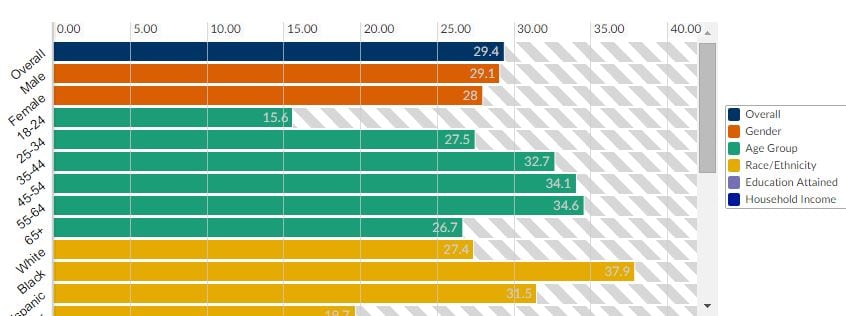
BRFSS: Graph of Current Binge Drinking among adults (interactive – click here)

bdrink

Posted in: Infographics on 09/18/2015 | Link to this post on IFP |
Share

Violence was more often alcohol-related in incidents involving male victims

arvimage2_tcm77-395304

Posted in: Infographics on 09/17/2015 | Link to this post on IFP |
Share

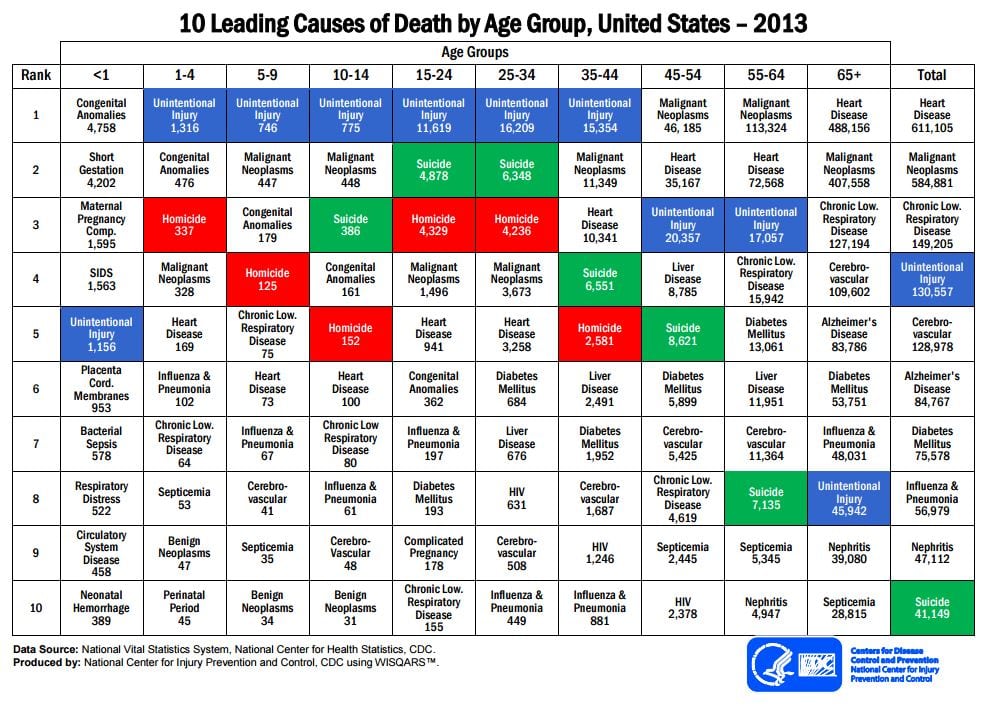
Leading causes of death

lcod

Posted in: Infographics on 09/16/2015 | Link to this post on IFP |
Share

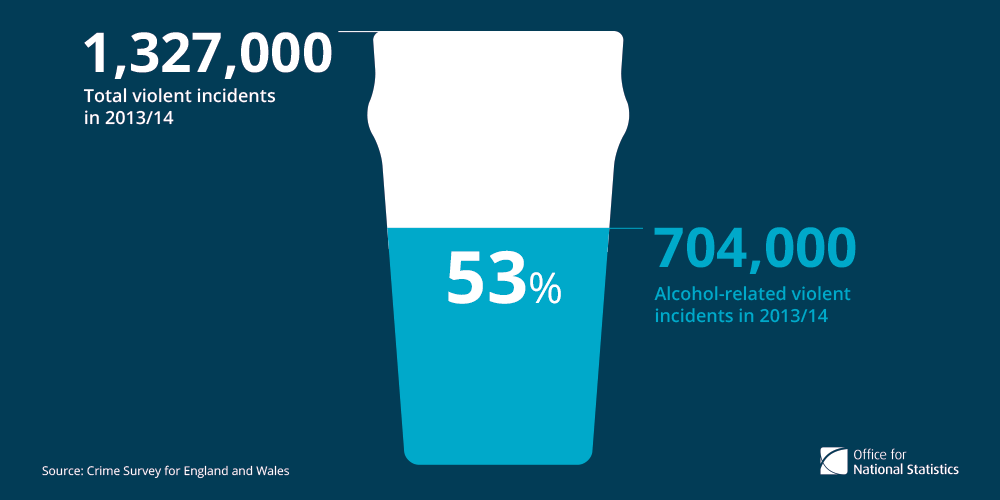
53% of violent incidents involving adults were alcohol-related.

arvimage1_tcm77-395301

Posted in: Infographics on 09/14/2015 | Link to this post on IFP |
Share

Deaths involving heroin and morphine similar to peak in 2001

herdeth

Posted in: Infographics on 09/13/2015 | Link to this post on IFP |
Share

Percentage of part-time workers by sex, UK, March-May 2014

genpt

Posted in: Infographics on 09/11/2015 | Link to this post on IFP |
Share

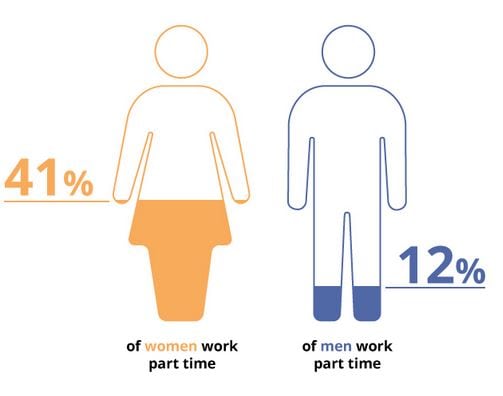
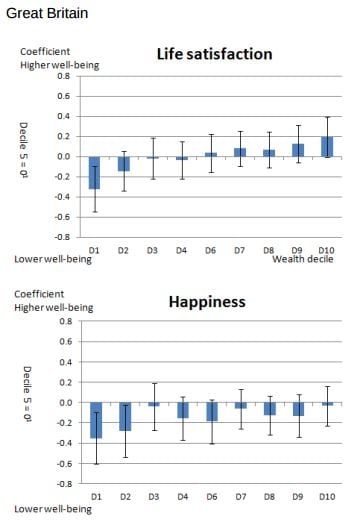
Figure 2: Relationships between total householdwealth decile groups and personal wellbeing, after controlling for individual characteristics, July 2011 to June 2012

ons333333

Posted in: Infographics on 09/09/2015 | Link to this post on IFP |
Share

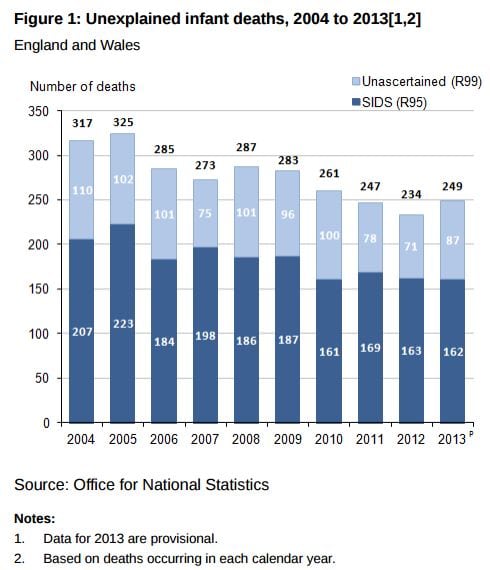
Unexplained deaths in infancy, England and Wales, 2013

ukud

Posted in: Infographics on 09/08/2015 | Link to this post on IFP |
Share

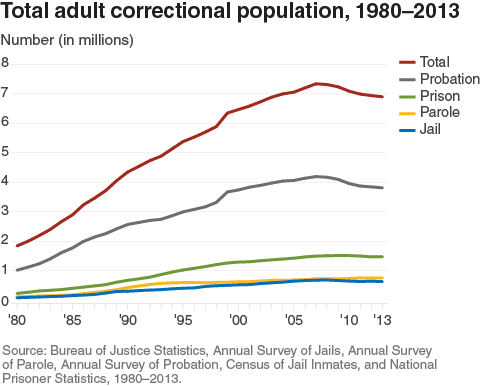
US: Total Correctional Population

Total_adult_correctional_population_1980_2013

Posted in: Infographics on 09/07/2015 | Link to this post on IFP |
Share

Percentage of Adults Aged 19–25 Years with a Usual Place of Care,* by Race/Ethnicity† — National Health Interview Survey, United States, 2010 and 2014

m6432qsf

Posted in: Infographics on 09/06/2015 | Link to this post on IFP |
Share

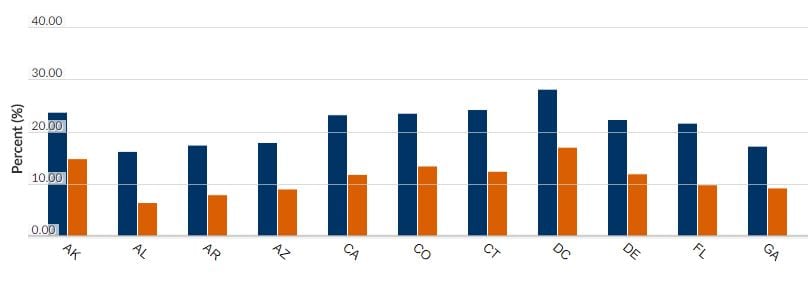
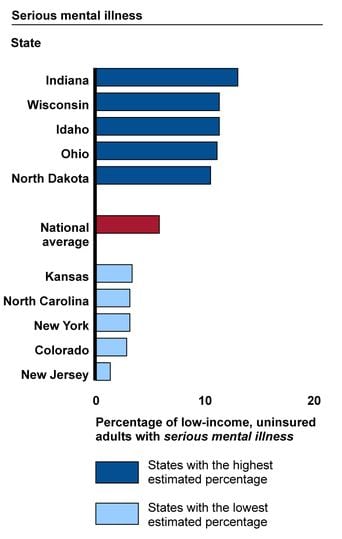
Estimated Percentage of Low-Income, Uninsured Adults with Behavioral Health Conditions Based on 2008 to 2013 Data, Highest and Lowest Five States

smiusppp

Posted in: Infographics on 09/05/2015 | Link to this post on IFP |
Share

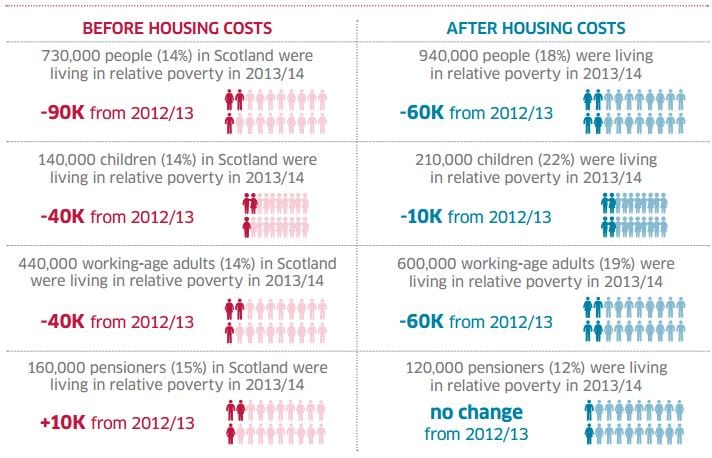
Relative Poverty in Scotland 2013/14

povscot

Posted in: Infographics on 09/04/2015 | Link to this post on IFP |
Share

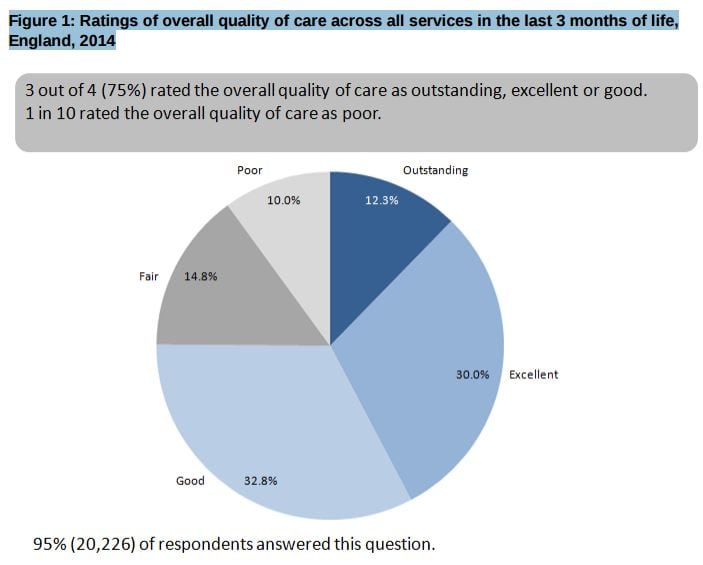
National Survey of Bereaved People (VOICES), 2014

beresveuk

Posted in: Infographics on 09/03/2015 | Link to this post on IFP |
Share

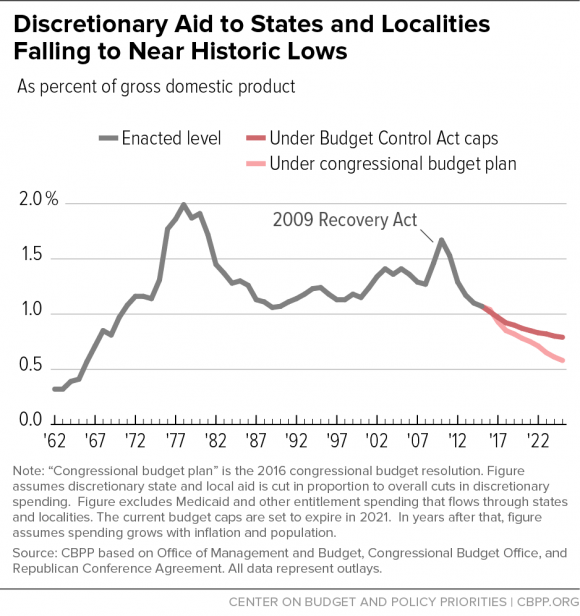
Federal Support for Most State and Local Programs Headed to 50-Year Low

150923_nddgrants_450

Posted in: Infographics on 09/03/2015 | Link to this post on IFP |
Share

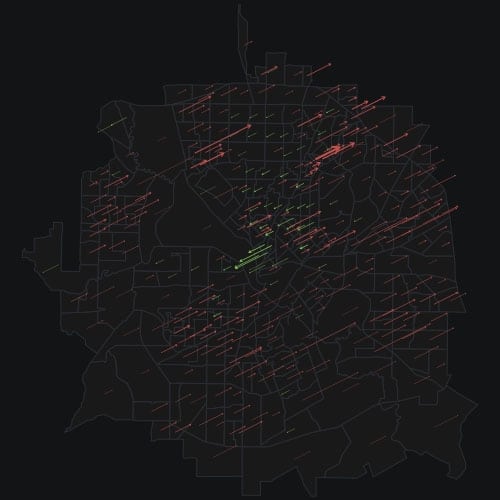
Visualizing Poverty Growth In Dallas

poverty-mapFrontburner | J Palmer

See that dark, brooding image above? That is an attempt to illustrate the increases and decreases in poverty in different neighborhoods in Dallas. The red arrows represent where poverty has increased. They are thicker where populations are denser and longer where poverty has increased more. The green arrows represent where poverty has decreased. You can see them clustered around Uptown and fanning out through the central part of North Dallas. The biggest decrease looks to be in West Dallas.

Posted in: Infographics on 09/02/2015 | Link to this post on IFP |
Share
  • « Go to Previous Page
  • Page 1
  • Interim pages omitted …
  • Page 70
  • Page 71
  • Page 72
  • Page 73
  • Page 74
  • Interim pages omitted …
  • Page 96
  • Go to Next Page »

Primary Sidebar

Categories

Category RSS Feeds

  • Calls & Consultations
  • Clinical Trials
  • Funding
  • Grey Literature
  • Guidelines Plus
  • History
  • Infographics
  • Journal Article Abstracts
  • Meta-analyses - Systematic Reviews
  • Monographs & Edited Collections
  • News
  • Open Access Journal Articles
  • Podcasts
  • Video

© 1993-2025 Dr. Gary Holden. All rights reserved.

gary.holden@nyu.edu
@Info4Practice