
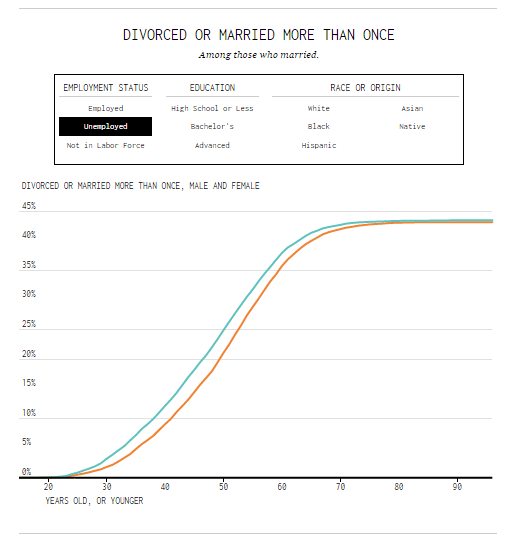
Divorce Rates for Different Groups (interactive – click here)
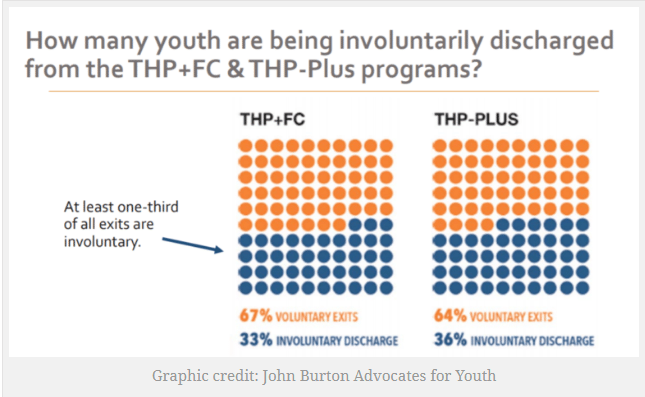
One-Third of California Foster Youth Leave Transitional Housing Involuntarily, Report Finds
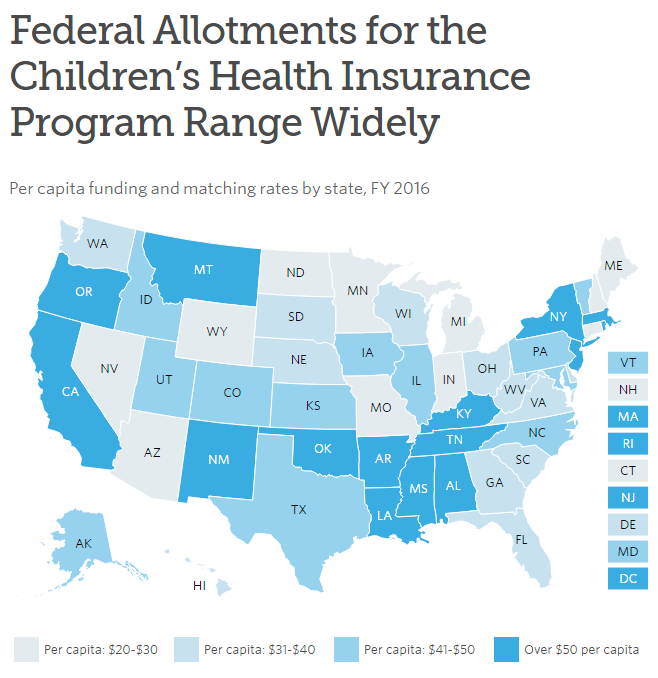
Children’s Health Insurance Program Funding and Structure Vary Significantly by State
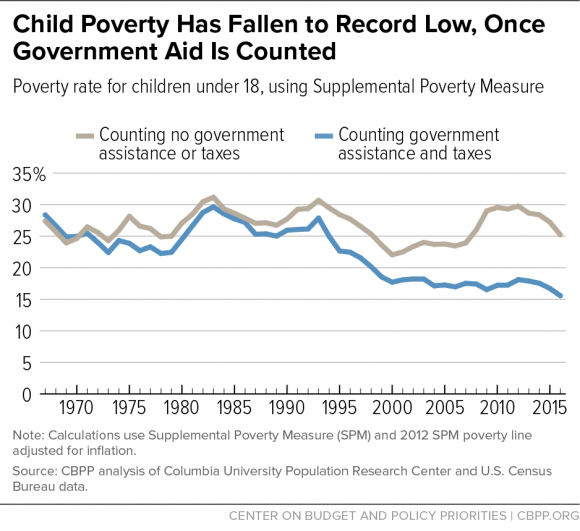
Child Poverty Falls to Record Low, Comprehensive Measure Shows Stronger Government Policies Account for Long-Term Improvement
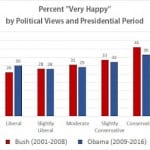
Political baseball: Happiness, unhappiness, and whose team is winning
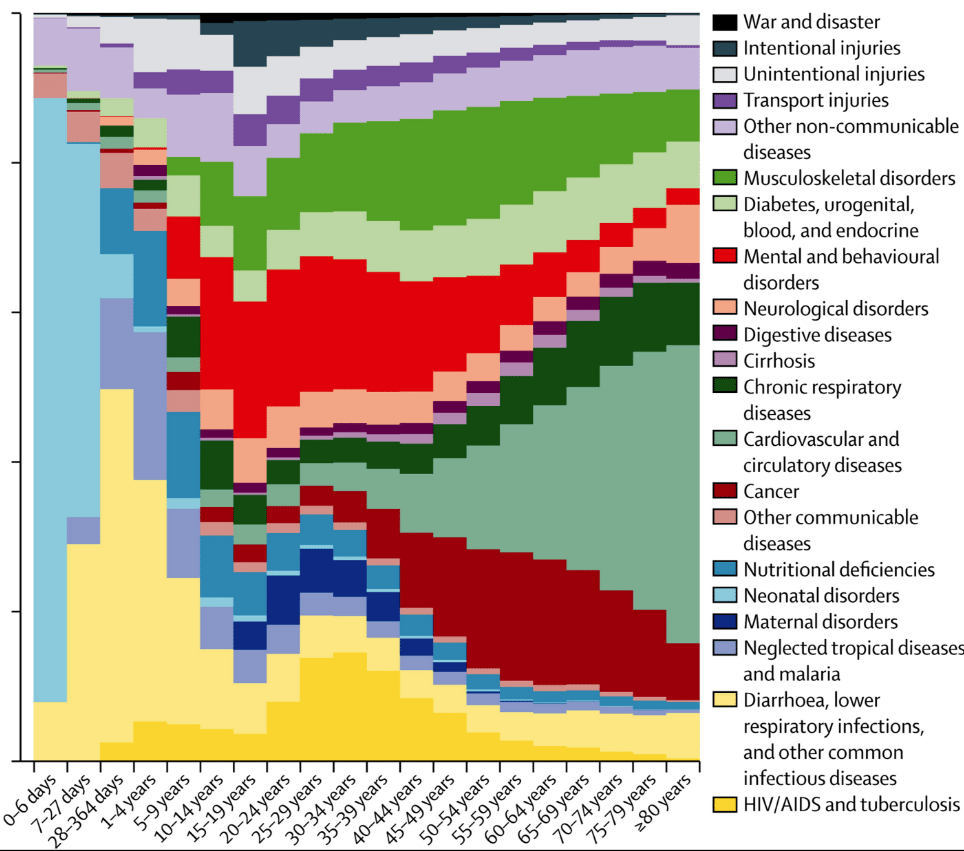
Disability-adjusted life years (DALYs) for 291 diseases and injuries in 21 regions, 1990–2010: a systematic analysis for the Global Burden of Disease Study 2010 (females in graphic)
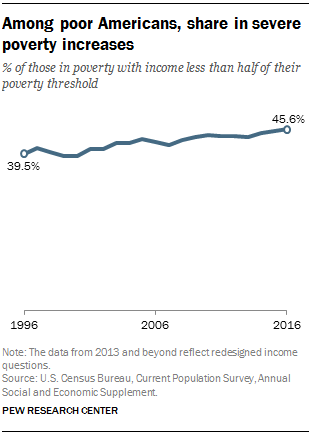
Americans deepest in poverty lost more ground in 2016
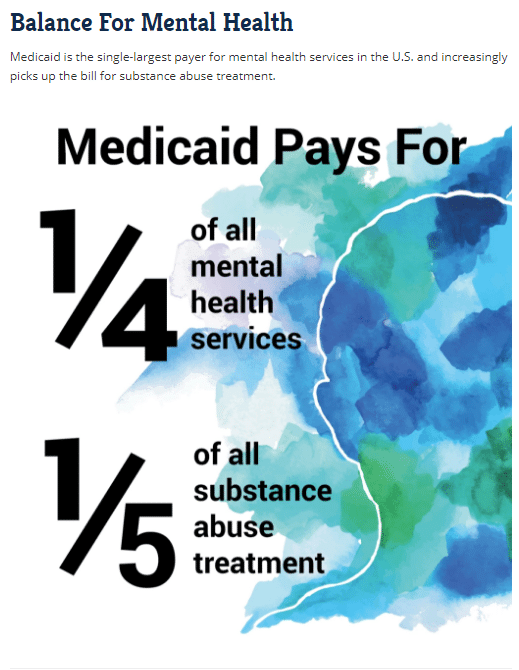
10 Ways Medicaid Affects Us All
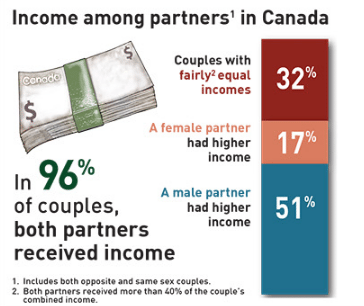
Statistics Canada – Income in Canada, 2016 Census of Population
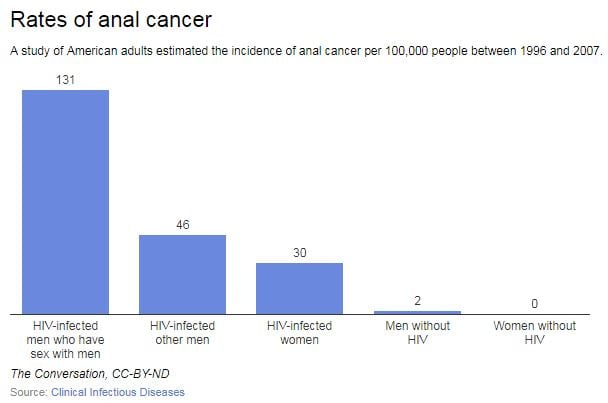
How the anal cancer epidemic in gay and bi HIV-positive men can be prevented
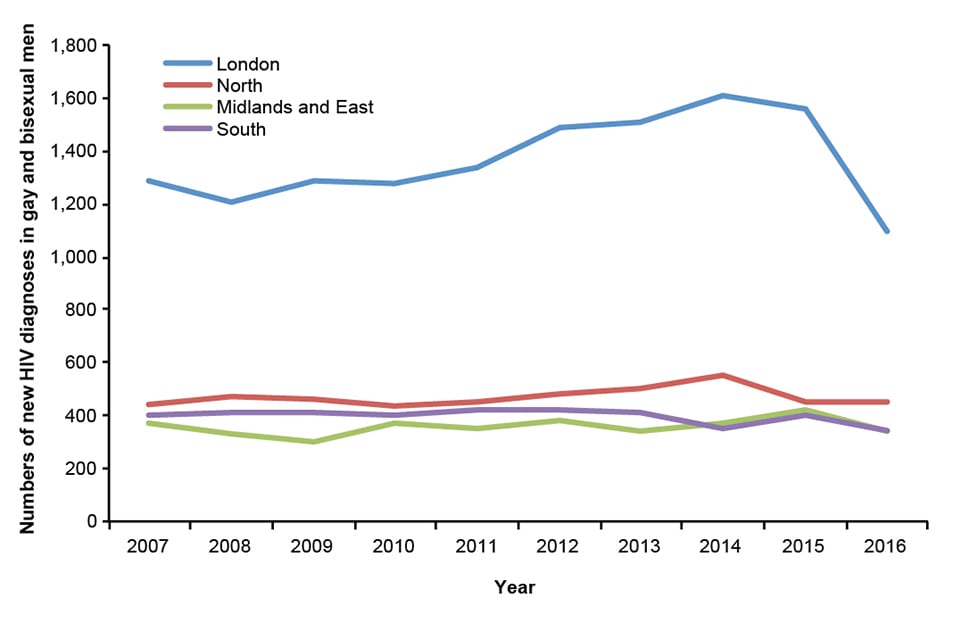
HIV in the UK: decline in new diagnoses in gay and bisexual men in London
Shifting Incomes for American Jobs (interactive – click here)

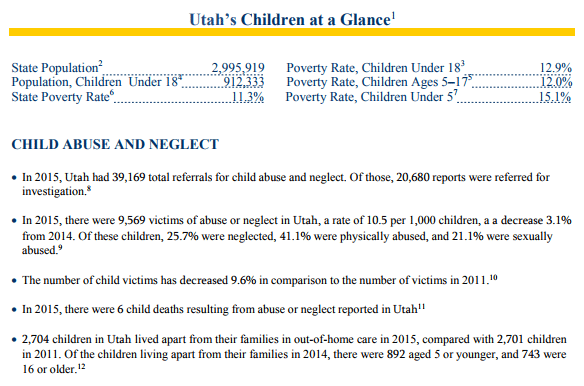
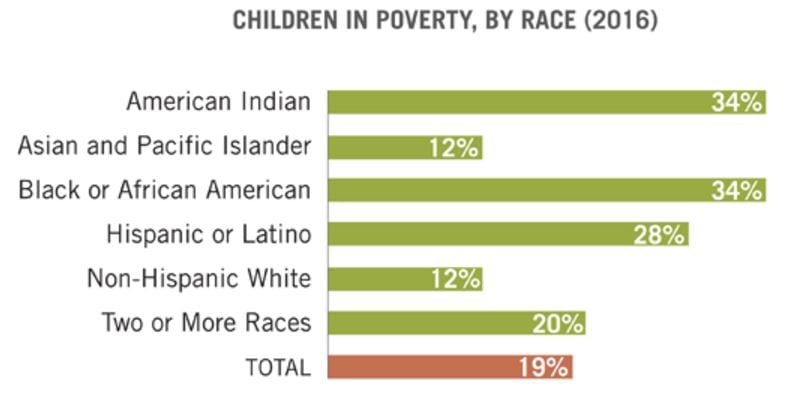
UTAH’S CHILDREN 2017
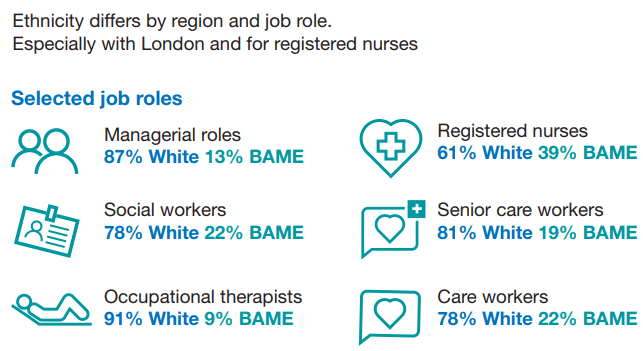
The ethnicity profile of the adult social care workforce in England, 2016
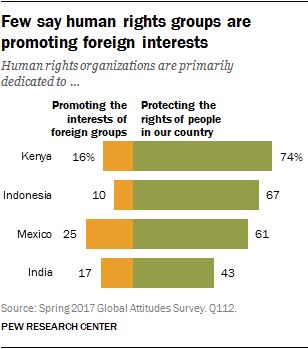
Public Attitudes Toward Human Rights Organizations: The Case of India, Indonesia, Kenya and Mexico
People who were abused as children are more likely to be abused as an adult

Urban noise pollution is worst in poor and minority neighborhoods and segregated cities
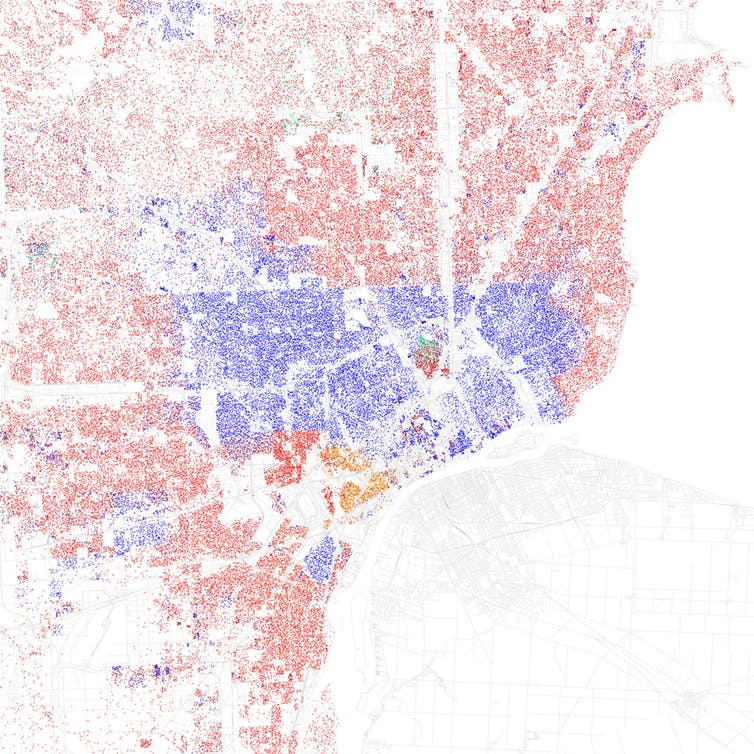
Map of racial and ethnic division in Detroit, based on 2010 US census data. Red = white, blue = black, green = Asian, orange = Hispanic, yellow = other; each dot represents 25 residents.
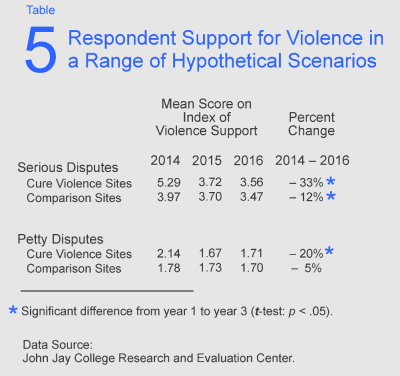
The Effects of Cure Violence in the South Bronx and East New York, Brooklyn
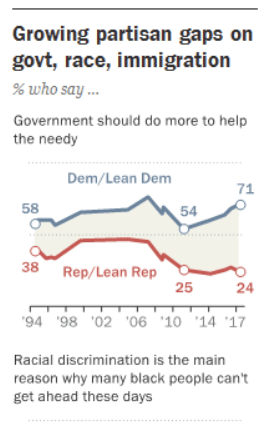
The Partisan Divide on Political Values Grows Even Wider
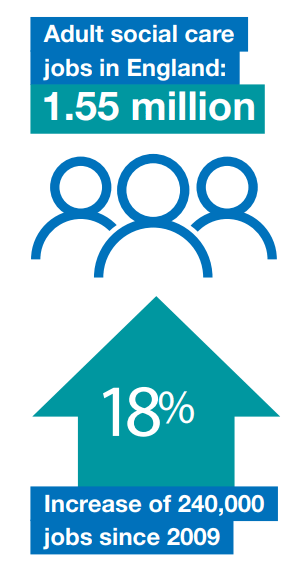
The size and structure of the adult social care sector and workforce in England, 2016
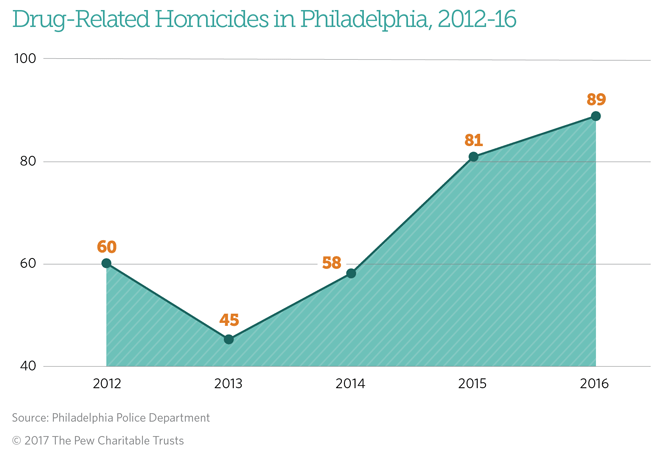
Philadelphia’s Drug-Related Homicides Continue to Rise
Child Poverty Still Falling — and Close to Pre-Recession Rate
Medicaid Has A Bull’s-Eye On Its Back, Which Means No One Is Entirely Safe

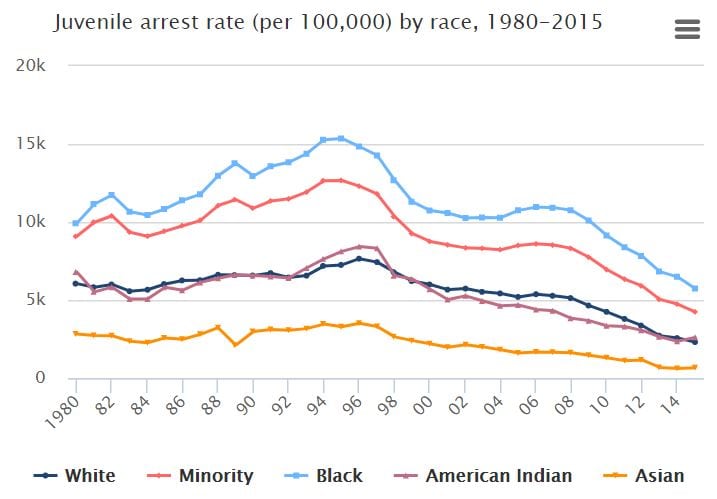
Juvenile arrests have declined for all race groups since the mid-1990s.
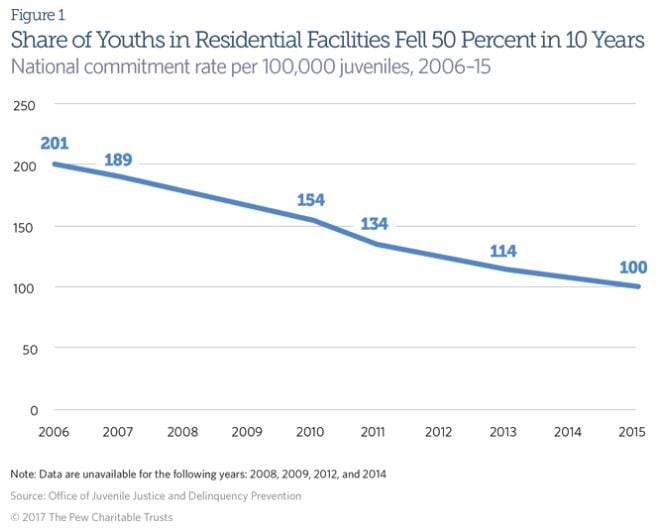
Juvenile Commitment Rate Falls by Half Nationally in 10 Years
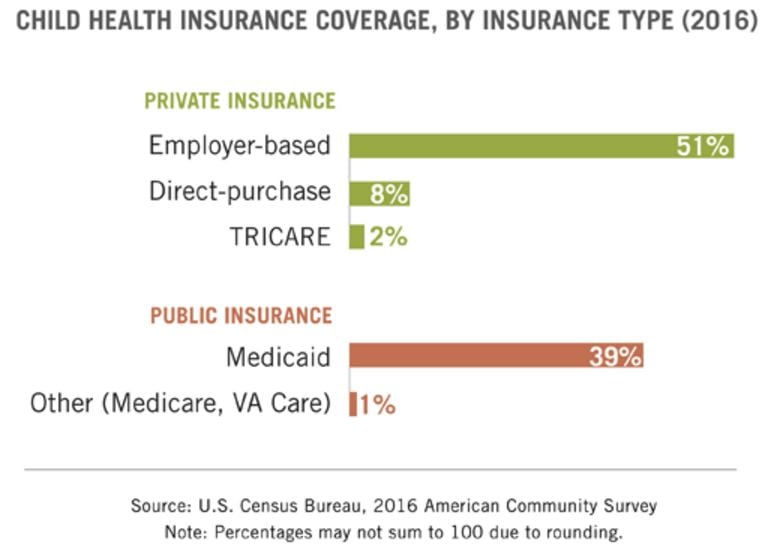
Record Coverage for Kids: 95% of U.S. Children Have Health Insurance
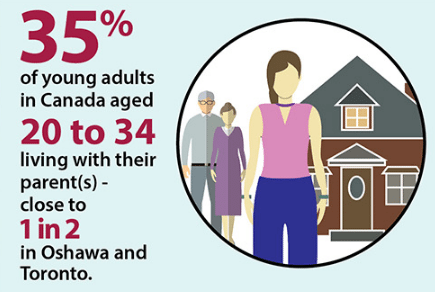
Portrait of households and families in Canada
Persons with a dental visit by family income, 2014

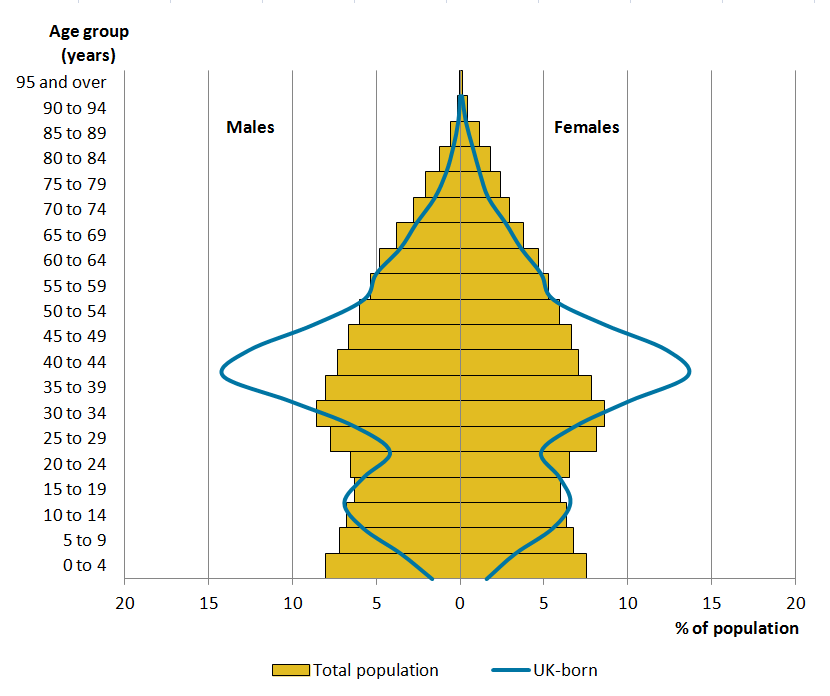
Figure 3: Population pyramid comparing the population of people born in the UK and living in Ireland with the overall population in Ireland, by age and sex, 2011
Human Immunodeficiency Virus Disease Death Rates* Among Women Aged 45–64 Years, by Race and Age Group — National Vital Statistics System, United States, 2000–2015
QuickStats: Percentage of Women Who Missed Taking Oral Contraceptive Pills Among Women Aged 15–44 Years Who Used Oral Contraceptive Pills and Had Sexual Intercourse, Overall and by Age and Number of Pills Missed — National Survey Of Family Growth, United States, 2013–2015
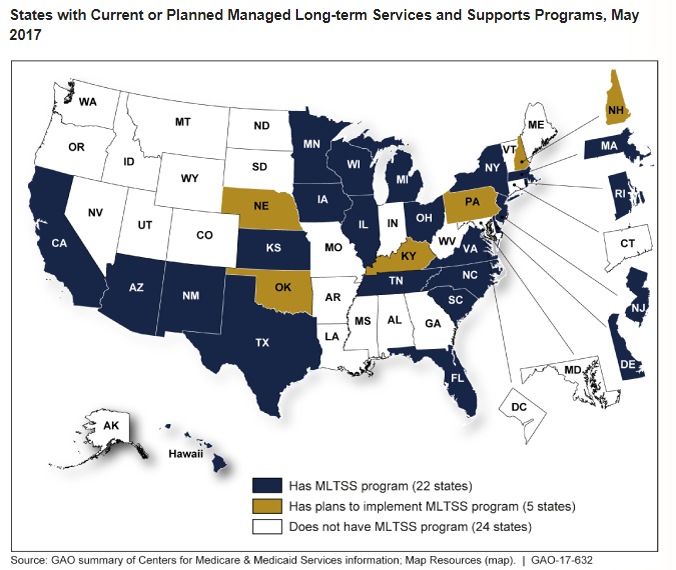
Medicaid Managed Care: CMS Should Improve Oversight of Access and Quality in States’ Long-Term Services and Supports Programs
Fast Facts & Figures About Social Security, 2017
Policy Basics: Where Do Federal Tax Revenues Come From?

Adult Obesity in the United States

Children in Care in Northern Ireland, 2015/16

OECD: Family benefits public spending Total, % of GDP 2000 – 2015 [interactive-click here]
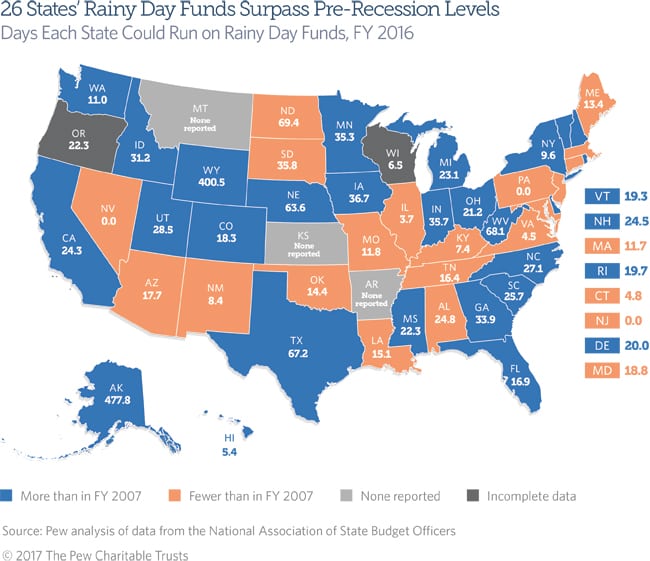
States Add to Reserves, Especially Rainy Day Funds
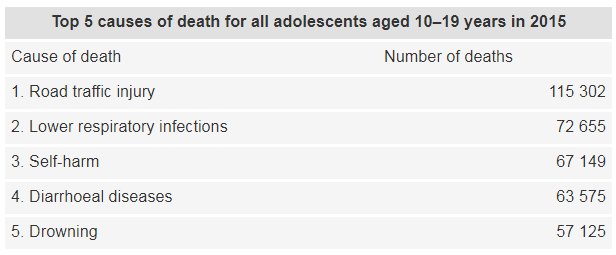
More than 1.2 million adolescents die every year, nearly all preventable
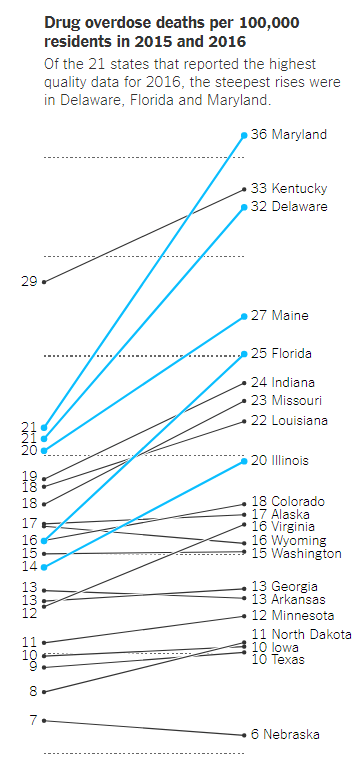
The First Count of Fentanyl Deaths in 2016: Up 540% in Three Years
How people around the world see education
Percentage* of Adults Who Ever Used an E-cigarette† and Percentage Who Currently Use E-cigarettes,§ by Age Group — National Health Interview Survey, United States, 2016
Medicaid Spending: Latest State Trends

Spending needs will grow
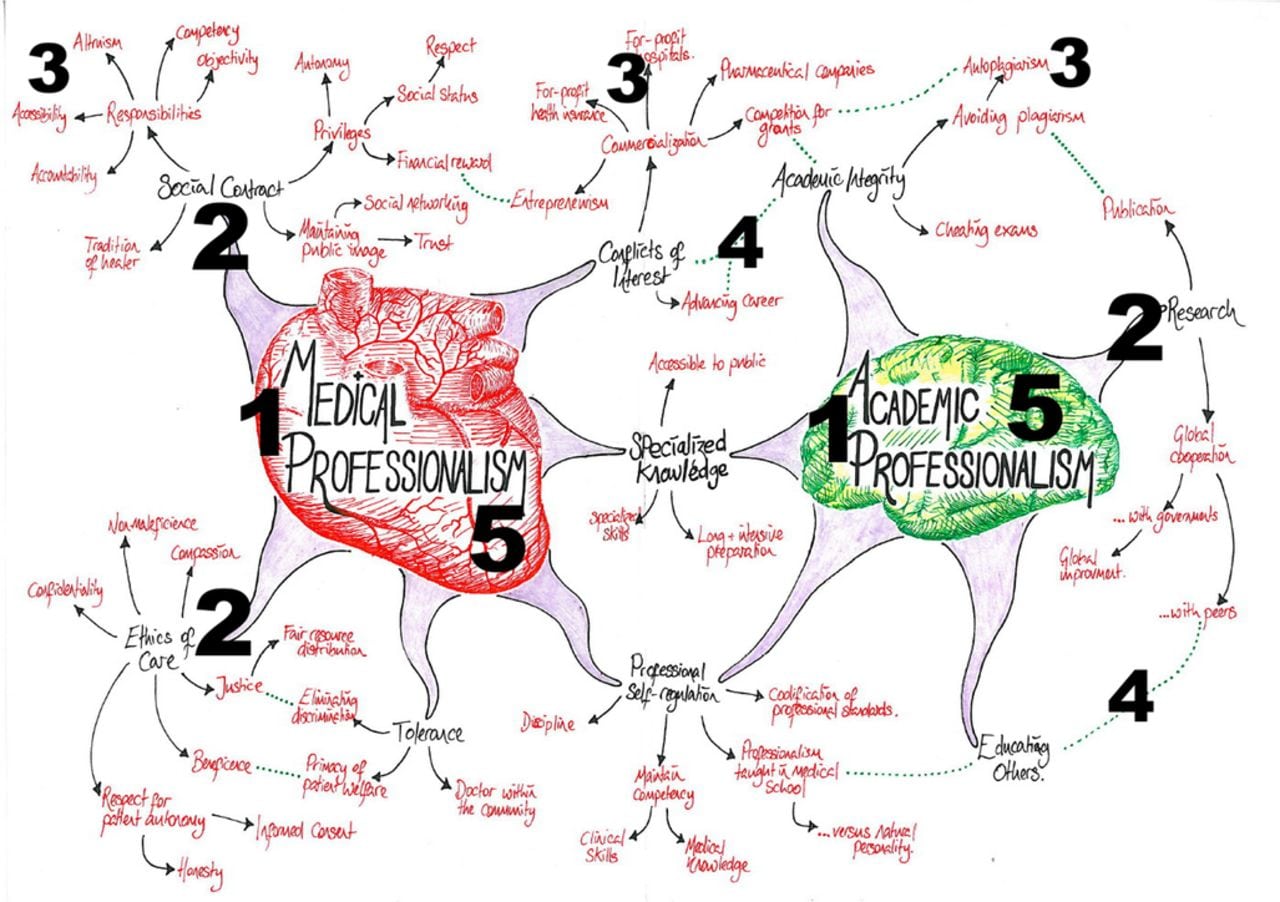
Preclinical medical students’ understandings of academic and medical professionalism: visual analysis of mind maps
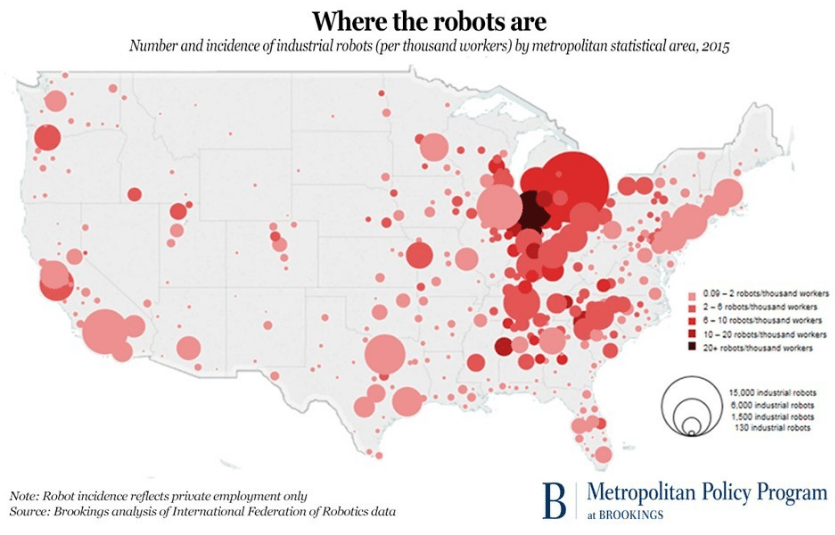
Where Robots Are Doing Factory Jobs
Partisan Shifts in Views of the Nation, but Overall Opinions Remain Negative
Individuals Reporting Alcohol Dependence or Abuse in the Past Year [Timeframe: 2014-2015]
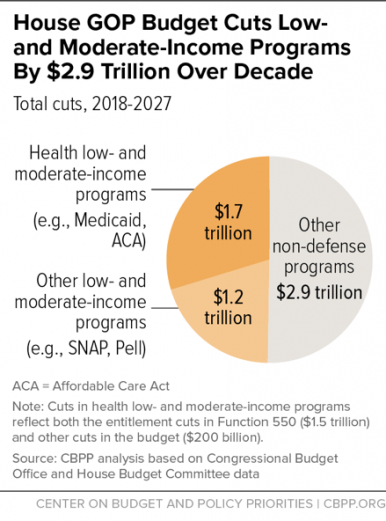
House GOP Budget Cuts Programs Aiding Low- and Moderate-Income People by $2.9 Trillion Over Decade
 CBPP
CBPP