• Skip to primary navigation
  • Skip to main content
  • Skip to primary sidebar

information for practice

news, new scholarship & more from around the world


advanced search
  • gary.holden@nyu.edu
  • @ Info4Practice
  • Archive
  • About
  • Help
  • Browse Key Journals
  • RSS Feeds

Infographics (4,766 posts)

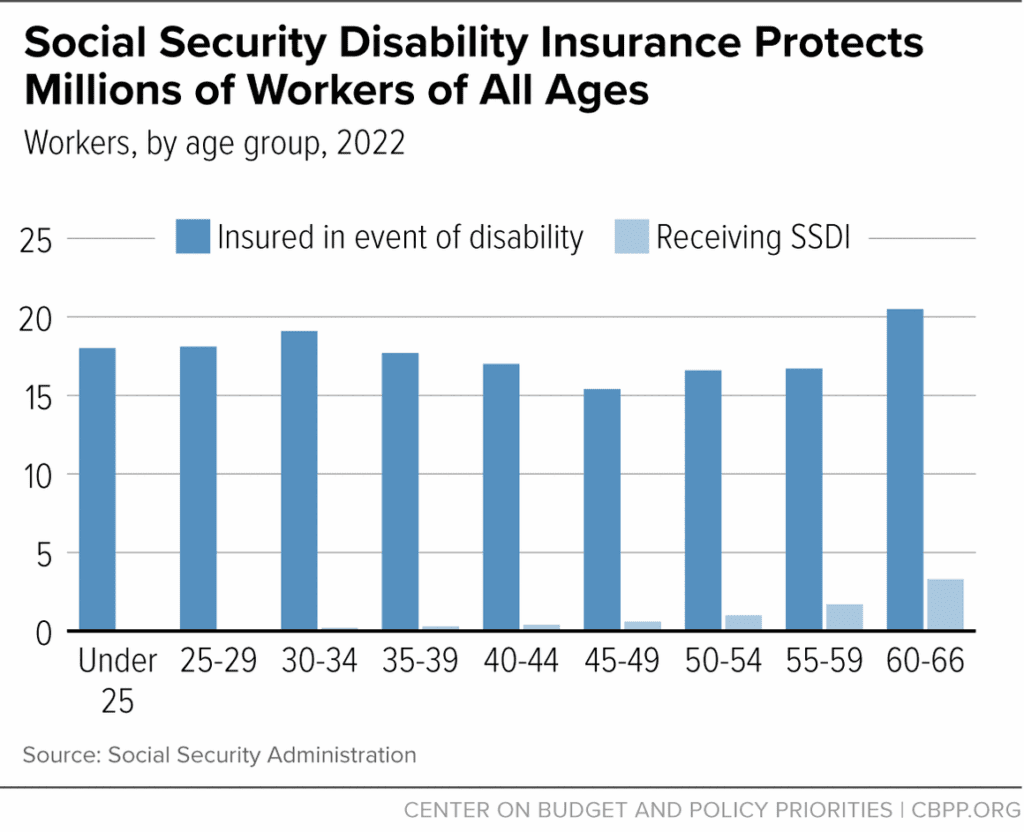
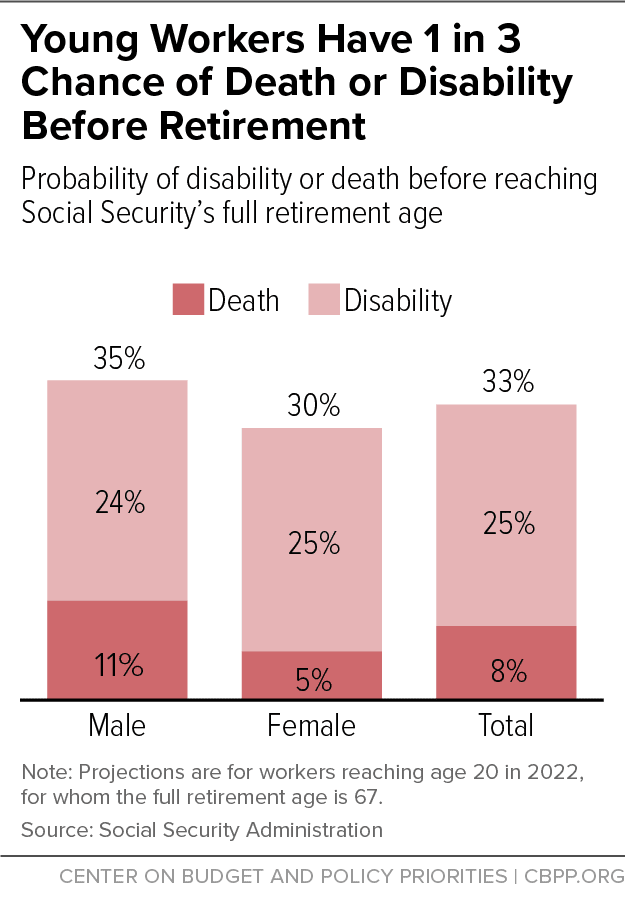
Social Security Disability Insurance: Insured / receiving

Posted in: Infographics on 01/30/2024 | Link to this post on IFP |
Share

Federal Justice Statistics, 2022

Posted in: Infographics on 01/29/2024 | Link to this post on IFP |
Share

The annual earnings of older workers

Posted in: Infographics on 01/29/2024 | Link to this post on IFP |
Share

Cuts to DC public transit would be a disaster, especially for the poor

Posted in: Infographics on 01/28/2024 | Link to this post on IFP |
Share

QuickStats: Percentage* of Children and Adolescents Aged 5–17 Years Who Had Been the Victim of Violence or Witnessed Violence in Their Neighborhood,† by Disability Status§ and Age Group — National Health Interview Survey, United States, 2022¶

Posted in: Infographics on 01/27/2024 | Link to this post on IFP |
Share

2023 saw some of the biggest, hardest-fought labor disputes in recent decades

Posted in: Infographics on 01/24/2024 | Link to this post on IFP |
Share

Social Security Disability Insurance – young workers

Posted in: Infographics on 01/23/2024 | Link to this post on IFP |
Share

Is Doctoral Education in the U.K. in Trouble?

Posted in: Infographics on 01/22/2024 | Link to this post on IFP |
Share

5 facts about Black Americans and health care

Posted in: Infographics on 01/22/2024 | Link to this post on IFP |
Share

How often teens visit online platforms

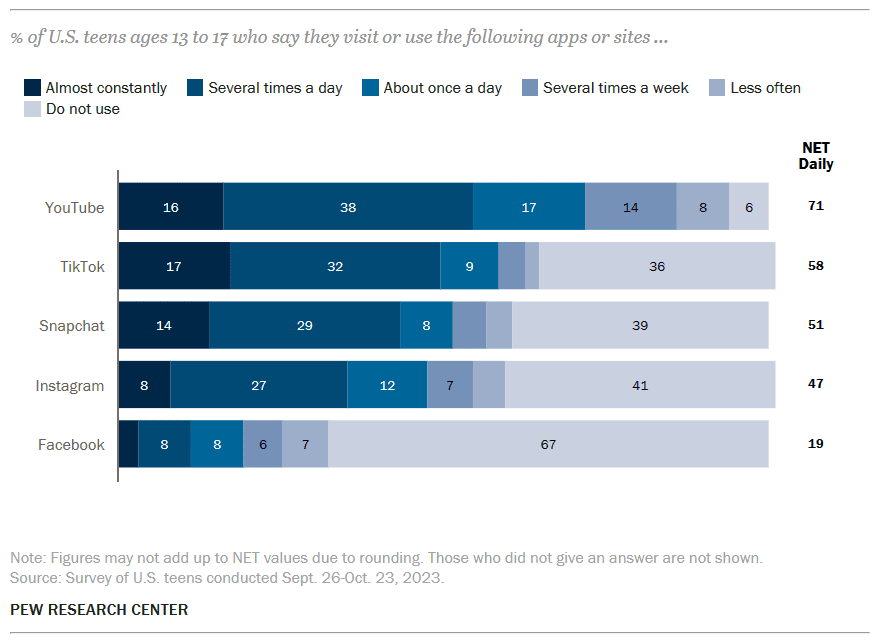
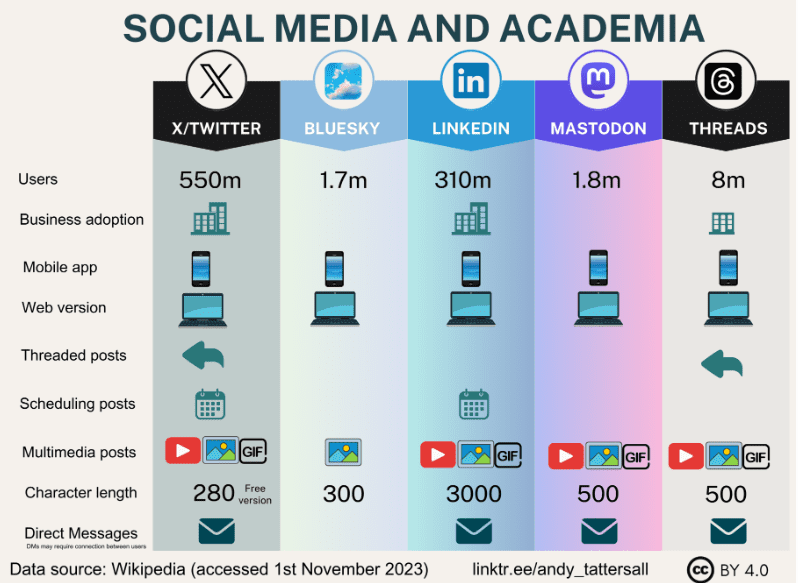
Many teens are on social media daily – if not constantly – but daily use varies by platform. About seven-in-ten U.S. teens say they visit YouTube every day – including 16% who do so almost constantly.

Posted in: Infographics on 01/21/2024 | Link to this post on IFP |
Share

States Are Providing Affordable Health Coverage to People Barred From Certain Health Programs Due to Immigration Status

Posted in: Infographics on 01/20/2024 | Link to this post on IFP |
Share

U.S. centenarian population is projected to quadruple over the next 30 years

Posted in: Infographics on 01/19/2024 | Link to this post on IFP |
Share

Reproductive Justice and TANF: Repealing “Family Cap” Policies Promotes Economic Justice and Family Autonomy

Posted in: Infographics on 01/18/2024 | Link to this post on IFP |
Share

The State of STIs

Posted in: Infographics on 01/18/2024 | Link to this post on IFP |
Share

10 facts about Americans and alcohol as ‘Dry January’ begins – 2

Posted in: Infographics on 01/17/2024 | Link to this post on IFP |
Share

Child Tax Credit Expansion Should Prioritize Cutting Child Poverty

Posted in: Infographics on 01/16/2024 | Link to this post on IFP |
Share

Student intentions to continue with distance learning post-COVID: An empirical analysis

Posted in: Infographics on 01/16/2024 | Link to this post on IFP |
Share

Honoring Martin Luther King Jr.’s Legacy With Census Data on Volunteerism, Voting Rights, Education and Economy

Posted in: Infographics on 01/15/2024 | Link to this post on IFP |
Share

Air pollution in the EU: facts and figures

Posted in: Infographics on 01/14/2024 | Link to this post on IFP |
Share

Rising Cost of Child Care Services a Challenge for Working Parents

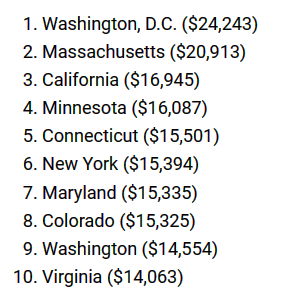
The Economic Policy Institute ranked the top 10 states or state equivalents with the highest child care expenses for preschool, infant care, and day care.

Posted in: Infographics on 01/13/2024 | Link to this post on IFP |
Share

Vaping and the Brain: Effects of Electronic Cigarettes and E-Liquid Substances

Posted in: Infographics on 01/12/2024 | Link to this post on IFP |
Share

Driving Impairment Among Older Adults

Posted in: Infographics on 01/12/2024 | Link to this post on IFP |
Share

Student pathways through postsecondary education, 2011 to 2021

Posted in: Infographics on 01/10/2024 | Link to this post on IFP |
Share

10 facts about Americans and alcohol as ‘Dry January’ begins – 1

Posted in: Infographics on 01/10/2024 | Link to this post on IFP |
Share

Disability in the EU: facts and figures

Posted in: Infographics on 01/08/2024 | Link to this post on IFP |
Share

Eviction Lab

We have been tracking weekly eviction filings since March 2020 to monitor the impact of the COVID-19 pandemic and associated policies.

Posted in: Infographics on 01/07/2024 | Link to this post on IFP |
Share

Survey of Household Spending, 2021

Posted in: Infographics on 01/07/2024 | Link to this post on IFP |
Share

Police-reported crime statistics in Canada, 2022

1
1
Posted in: Infographics on 01/05/2024 | Link to this post on IFP |
Share

3 years after the Marshall Fire: Wildfire smoke’s health risks can linger long-term in homes that escape burning

A survey of 579 residents who reported homes smelling like smoke or chemicals one week after the Marshall Fire found that 55% had at least one health symptom six months later. Of the 389 who responded to a follow-up survey a year later, 33% had at least one health symptom.

Posted in: Infographics on 01/04/2024 | Link to this post on IFP |
Share

Incentives Can Improve Probation Success

Posted in: Infographics on 01/03/2024 | Link to this post on IFP |
Share

QuickStats: Age-Adjusted Percentage* of Adults Aged ≥18 Years Who Reported Their Level of Satisfaction with Life,† by Disability Status§ — National Health Interview Survey,¶ United States, 2022

Posted in: Infographics on 01/02/2024 | Link to this post on IFP |
Share

2023 Data in review

Posted in: Infographics on 01/01/2024 | Link to this post on IFP |
Share

Happy New Year 2024

Posted in: Infographics on 01/01/2024 | Link to this post on IFP |
Share

Methodological quality of Campbell Systematic Reviews has improved over the past decade

Posted in: Infographics on 01/01/2024 | Link to this post on IFP |
Share

Chart 1. Victims of police-reported family violence and intimate partner violence, by type of violence, gender and year, Canada, 2009 to 2022

Posted in: Infographics on 12/31/2023 | Link to this post on IFP |
Share

UAW Agreement Strengthens Retirement Security

Figure-1_UAW-1
Figure-1_UAW-1
Posted in: Infographics on 12/31/2023 | Link to this post on IFP |
Share

Delinquency Cases Waived to Criminal Court, 2020

Posted in: Infographics on 12/30/2023 | Link to this post on IFP |
Share

State Menthol Fact Sheets

Posted in: Infographics on 12/29/2023 | Link to this post on IFP |
Share

Homicide trends in Canada, 2022

Posted in: Infographics on 12/28/2023 | Link to this post on IFP |
Share

Delinquency Cases in Juvenile Court: 2020

Posted in: Infographics on 12/27/2023 | Link to this post on IFP |
Share

Evaluating Fast Track Social Work-Qualifying Programmes: Have We Learnt Anything?

Posted in: Infographics on 12/26/2023 | Link to this post on IFP |
Share

Do employers address issues with high caseloads in social work teams?

Posted in: Infographics on 12/24/2023 | Link to this post on IFP |
Share

Winter is coming: How laypeople think about different kinds of needs

Posted in: Infographics on 12/23/2023 | Link to this post on IFP |
Share

Trends and Characteristics of Youth in Residential Placement, 2021

Posted in: Infographics on 12/22/2023 | Link to this post on IFP |
Share

X, LinkedIn, Bluesky, Mastodon, Threads… TikTok? How to choose in a fractured academic social media landscape

Posted in: Infographics on 12/21/2023 | Link to this post on IFP |
Share

Average Number of Stroke* Deaths per Day, by Month and Sex — National Vital Statistics System, United States, 2021

Posted in: Infographics on 12/20/2023 | Link to this post on IFP |
Share

What is the impact of depression on years of employment among working-age adults?

Posted in: Infographics on 12/19/2023 | Link to this post on IFP |
Share

Key findings of the 2023 report of the Lancet Countdown on health and climate change

Posted in: Infographics on 12/18/2023 | Link to this post on IFP |
Share

Child Poverty Rate Still Higher Than For Older Populations But Declining

Posted in: Infographics on 12/16/2023 | Link to this post on IFP |
Share

Percentage of Population Without Health Insurance Coverage by State: 2021 and 2022

Posted in: Infographics on 12/15/2023 | Link to this post on IFP |
Share
  • « Go to Previous Page
  • Page 1
  • Interim pages omitted …
  • Page 12
  • Page 13
  • Page 14
  • Page 15
  • Page 16
  • Interim pages omitted …
  • Page 96
  • Go to Next Page »

Primary Sidebar

Categories

Category RSS Feeds

  • Calls & Consultations
  • Clinical Trials
  • Funding
  • Grey Literature
  • Guidelines Plus
  • History
  • Infographics
  • Journal Article Abstracts
  • Meta-analyses - Systematic Reviews
  • Monographs & Edited Collections
  • News
  • Open Access Journal Articles
  • Podcasts
  • Video

© 1993-2025 Dr. Gary Holden. All rights reserved.

gary.holden@nyu.edu
@Info4Practice