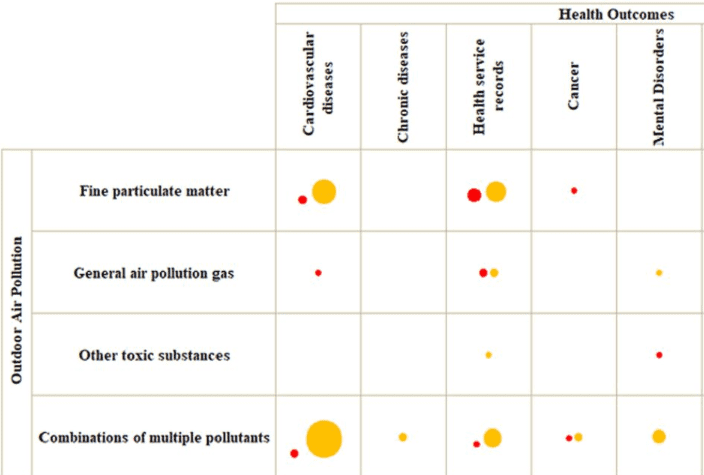
Figure 4. EGM for health outcomes affected by outdoor air pollution. The colours of the bubbles represent the confidence of included SRs and MAs; red colour represents low confidence and yellow colour represents medium confidence. The size of the bubbles indicates the relative number of included SRs and MAs, and a larger bubble represents a larger study sample size in each grid. EGM, evidence gap map; SRs, systematic reviews; MAs, meta-analyses.