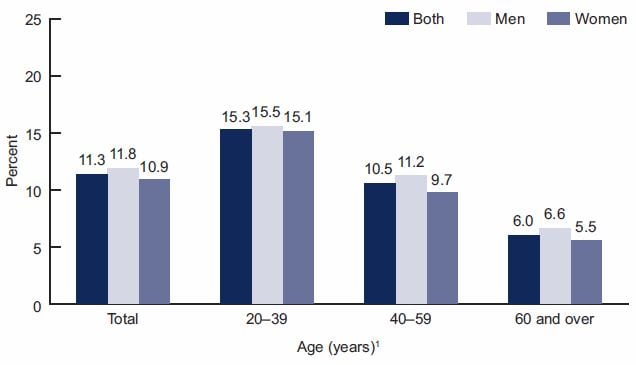
 CDC | National Health and Nutrition Examination Survey, 2007–2010
1 Significant linear trend by age (p < 0.05).
NOTE: Total estimates are age adjusted to the 2000 projected U.S. standard population using three age groups: 20–39, 40–59, and 60 and over.