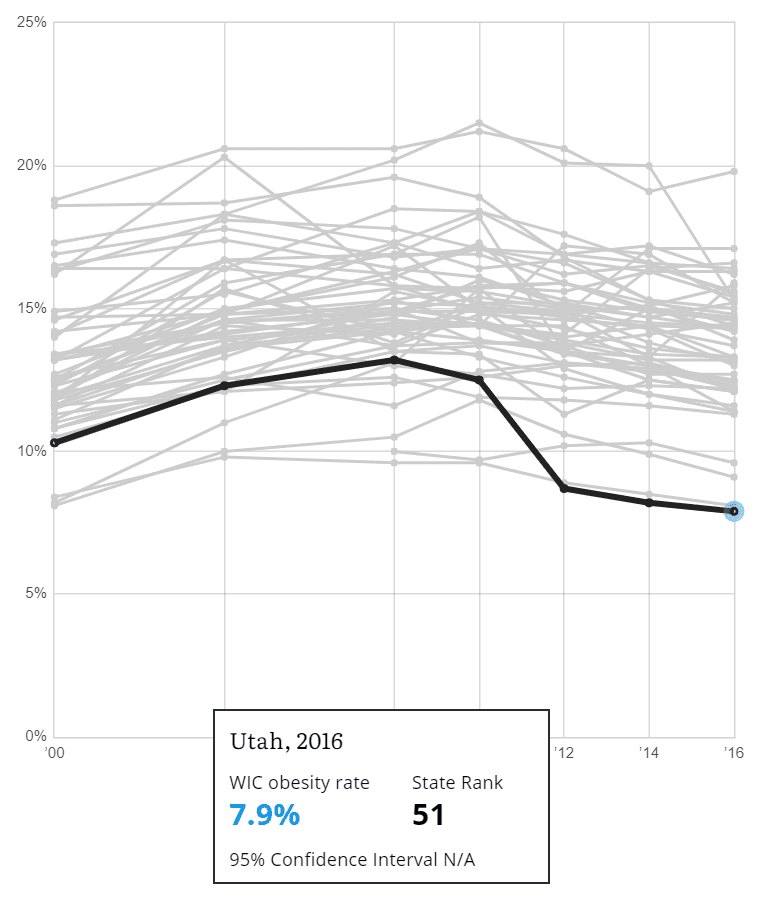
If You’re Over 50, Chances Are the Decision to Leave a Job Won’t be Yours
An Extremely Detailed Map of the 2016 Presidential Election (interactive)
Who Cares: A National Count of Foster Homes and Families
1 in 55 U.S. Adults Is on Probation or Parole (interactive)
2018 Estimates of Drug Use in the Europen Union
Top 1.0 percent reaches highest wages ever—up 157 percent since 1979
Advancing Racial Equity With State Tax Policy
Anabolic Steroids
Foster youth who are living in group homes, institutions, and other residential care settings
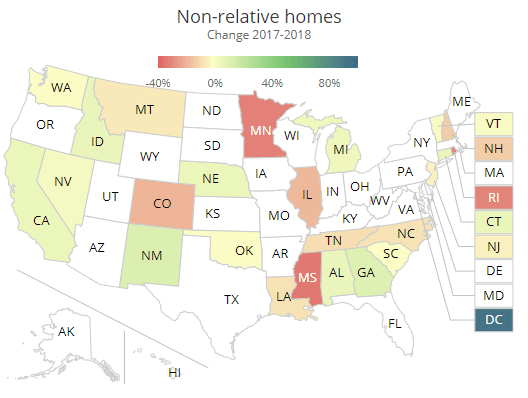
Includes US total and percent change from 2012 to 2016
Are you in the American middle class? Find out with our income calculator
Vast Majority of Those Losing Coverage From Medicaid Waivers Will Be Uninsured
Commentary: As Predicted, Arkansas’ Medicaid Waiver Is Taking Coverage Away From Eligible People
Classroom Diversity
U.S. Homelessness Edges Higher Again After Seven Years of Declines
Childhood Poverty, 2007 – 2017
How Corporate Tax Incentives Rob Public School Budgets
National Homeless Persons’ Memorial Day: December 21, 2018
More Imprisonment Does Not Reduce State Drug Problems
Offending by juveniles
Computer and Internet Use in the United States: 2016
Indian Child Welfare Act Under Fire: Federal Judge Strikes Down 40-Year-Old Law, Appeals Could Lead to Supreme Court
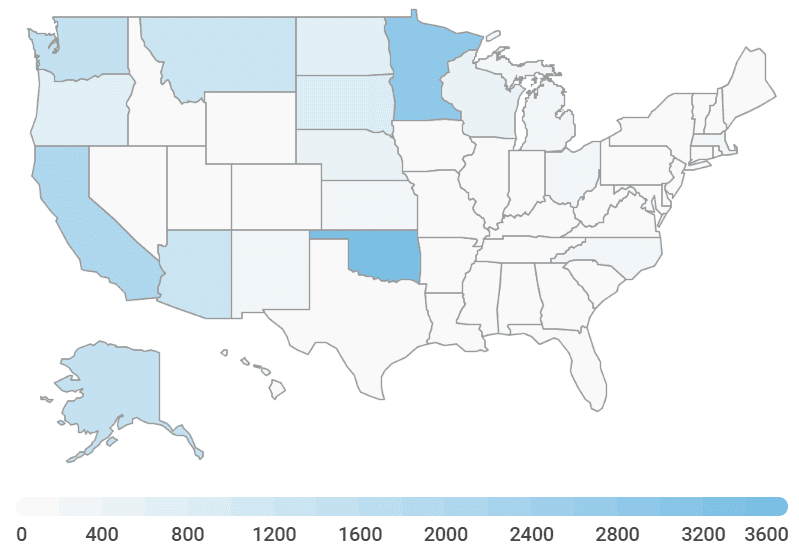
Above: American Indian Youth in Foster Care by State (interactive)
Latina workers have to work 10 months into 2018 to be paid the same as white non-Hispanic men in 2017
Chart Book: Temporary Assistance for Needy Families
Percentage Change in Median Household Income of the Total Population by County: 2007 to 2017
Characteristics of delinquency cases handled in juvenile court in 2016
Criminal Victimization, 2016: Revised
Police reveal how many reported crimes are connected to domestic violence
Teens’ Social Media Habits and Experiences
WHO: HIV/AIDS
Americans Favor Expanded Pretrial Release, Limited Use of Jail
Economies of ale: small pubs close as chains focus on big bars
Health matters: air pollution
Policy Brief: TANF Reaching Few Poor Families
Timeline of HIV/AIDS
Figure 5: Total time spent by parents with young children, by region
Proportion of mother tongue responses for various regions in Canada, 2016 Census – Quebec
Early Benchmarks Show ‘Post-Millennials’ on Track to Be Most Diverse, Best-Educated Generation Yet
TANF Studies Show Work Requirement Proposals for Other Programs Would Harm Millions, Do Little to Increase Work
Despite recent violence, Chicago is far from the U.S. ‘murder capital’
For communities of color, nearby industry leads to pollution but not employment
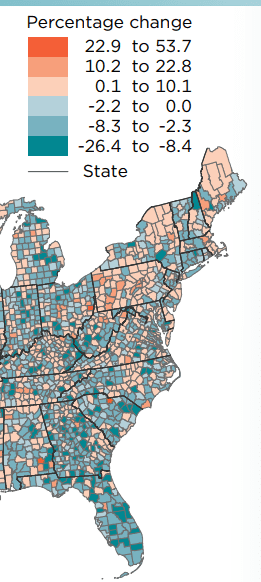
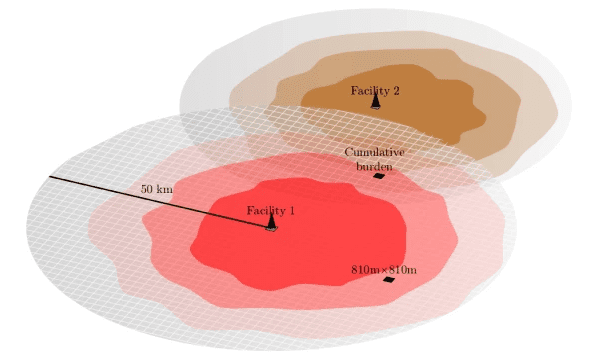
Figure 1. Schematic of RSEI model. Rather than an indiscriminate circle drawn around a given industrial facility, the areas most burdened by pollution tend to be located inside an oval shape, flowing west to east from the facility.